速记速查。
一、echarts 调整图表 位置 的方法
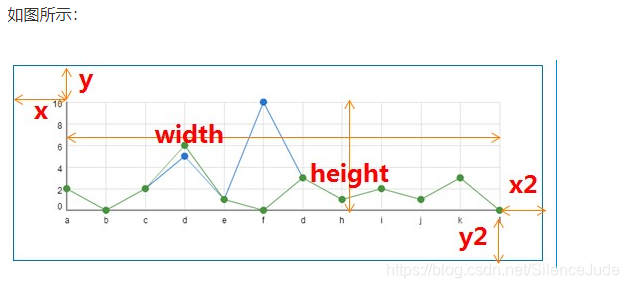
调整画布内,图像的总体偏移位置,设置grid属性就可以了
            myChart.setOption({
                title:{
                    text:"价格指数"
                },
                grid:{
                    x:25,//可以只设置一个属性,我只用了一个x:40
                    y:45,
                    x2:5,
                    y2:20,
                    borderWidth:1
                },
                ...
二、修改柱状图颜色。
在柱状图的代码series:[]中,设置itemStyle即可。
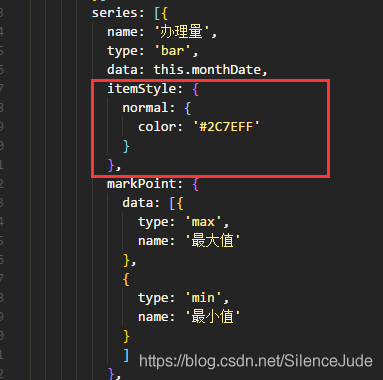
        series: [{
          name: '办理量',
          type: 'bar',
          data: this.monthDate,
          itemStyle: {
            normal: {
              color: '#2C7EFF'
            }
          },
          ...
三、vue开发环境中全局引入echarts。
1.首先npm安装 echarts,命令是:
npm install echarts --save
2.在main.js中全局引入
// 引入echarts
import echarts from 'echarts'

Vue.prototype.$echarts = echarts
3、在需要绘制的组件中创建画布的容器div。
<div id="myChart" :style="{width: '300px', height: '300px'}"></div>
4、直接在该组件中使用,通过this.$echarts.init()来初始化。
<script>
export default {
  name: 'hello',
  data () {
    return {
      msg: 'Welcome to Your Vue.js App'
    }
  },
  mounted(){
    this.drawLine();
  },
  methods: {
    drawLine(){
        // 基于准备好的dom,初始化echarts实例
        let myChart = this.$echarts.init(document.getElementById('myChart'))
        // 绘制图表
        myChart.setOption({
            title: { text: '在Vue中使用echarts' },
            tooltip: {},
            xAxis: {
                data: ["衬衫","羊毛衫","雪纺衫","裤子","高跟鞋","袜子"]
            },
            yAxis: {},
            series: [{
                name: '销量',
                type: 'bar',
                data: [5, 20, 36, 10, 10, 20]
            }]
        });
    }
  }
}
</script>
四、在vue生产环境中,按需引用echarts组件。
1.首先npm安装 echarts,命令是:
npm install echarts --save
2、在需要绘制的组件中创建画布的容器div。
<div id="myChart" :style="{width: '300px', height: '300px'}"></div>
3、在该组件中按需引入echarts的模块。
如果需要引用其他功能就要引用其他模块,详见官网。
<script>
//引入echarts需要使用到的基础模板。
const echarts = require('echarts/lib/echarts')
// 引入柱状图组件
require('echarts/lib/chart/bar')
// 引入提示框和title组件
require('echarts/lib/component/tooltip')
require('echarts/lib/component/title')
export default {
	data(){
		return{
			......
		}
	}
}
</script>
4、直接在该组件中使用,通过echarts.init()来初始化。
<script>
// 引入基本模板
let echarts = require('echarts/lib/echarts')
// 引入柱状图组件
require('echarts/lib/chart/bar')
// 引入提示框和title组件
require('echarts/lib/component/tooltip')
require('echarts/lib/component/title')
export default {
  name: 'hello',
  data() {
    return {
      msg: 'Welcome to Your Vue.js App'
    }
  },
  mounted() {
    this.drawLine();
  },
  methods: {
    drawLine() {
      // 基于准备好的dom,初始化echarts实例
      let myChart = echarts.init(document.getElementById('myChart'))
      // 绘制图表
      myChart.setOption({
        title: { text: 'ECharts 入门示例' },
        tooltip: {},
        xAxis: {
          data: ["衬衫", "羊毛衫", "雪纺衫", "裤子", "高跟鞋", "袜子"]
        },
        yAxis: {},
        series: [{
          name: '销量',
          type: 'bar',
          data: [5, 20, 36, 10, 10, 20]
        }]
      });
    }
  }
}
</script>