【6-1】用图形表示连续调制波形y = sintsin(9t)及其包络线。
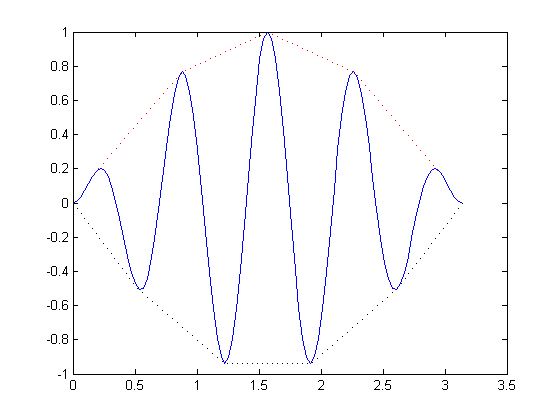
t = 0:pi/100:2*pi;
plot(t,sin(t).*sin(9*t));
hold on
t1 = pi/18:2*pi/9:pi;
plot(t1,sin(t1).*sin(9*t1),'r:');
hold on
t2 = pi/6:2*pi/9:pi;
plot(t2,sin(t2).*sin(9*t2),'k:');
hold on
t2 = 0:pi/6:pi/6;
plot(t2,sin(t2).*sin(9*t2),'k:');
hold on
t2 = 5*pi/6:pi/6:pi;
plot(t2,sin(t2).*sin(9*t2),'k:');
【6-2】在函数y = 1 - e^(-at)cos(ωt)的曲线下,标示出函数名称、横坐标、纵坐标、α = 0.2、ω = 0.9、函数极大值与终了值等。
t = 0:pi/100:2*pi; 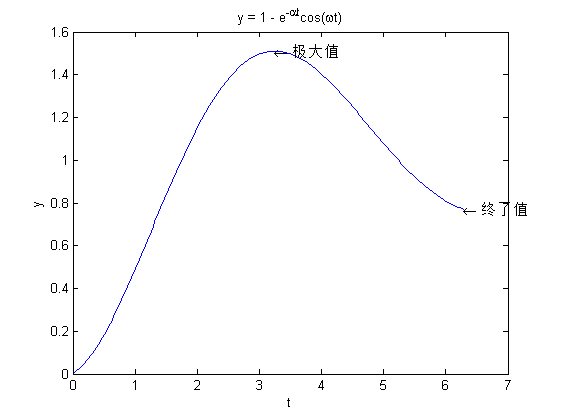
y = 1 - exp(-0.2.*t).*cos(0.9.*t);
plot(t,y);
xlabel('t');
ylabel('y');
text(3.25,1.51,'\leftarrow 极大值');
text(6.28,0.77,'\leftarrow 终了值');
title('y = 1 - e^{-\alphat}cos(\omegat)');
【6-3】在极坐标中,绘制函数(1)costsint与(2)极坐标方程r = 0.01e^0.1Θ的极坐标曲线。

(1)syms t;
ezpolar(sin(t)*cos(t));
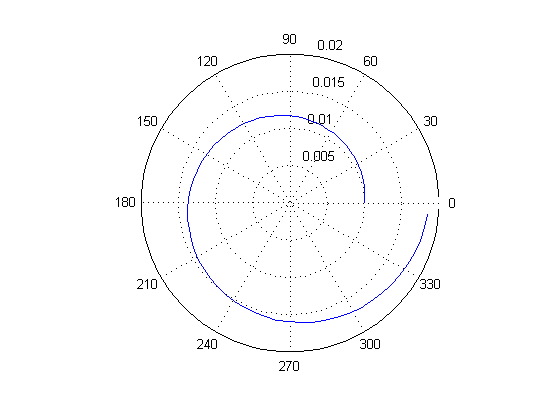
(2)t = 0:0.1:2*pi;
rho = 0.01.*exp(0.1.*t);
polar(t,rho);
【6-4】在同一坐标中,绘制函数(1)sint与(2)cost的曲线,并添加图例。
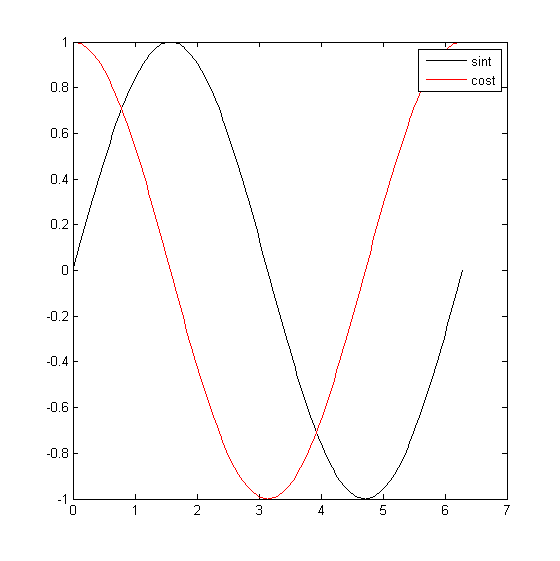
t = 0:pi/100:2*pi;
plot(t,sin(t),'k');
hold on
plot(t,cos(t),'r');
hold on
legend('sint','cost');