知识点1:Python zip()函数
原文demo
def fit(self,X,y):

        self.w_ = np.zeros(1+X.shape[1])
        self.errors_ = []
        for _ in range(self.epoch):
            errors = 0
            for xi,target in zip(X,y):
                update = self.alpha*(target-self.predict(xi))
                self.w_[1:] += update*xi
                self.w_[0] += update
                errors += int(update!=0.0)
            self.errors_.append(errors)
        return self
作用:将两个数组打包为元组
eg:
a=[1,2,3]
b=[4,5,6]
c=zip(a,b)
#c:[(1,4),(2,5),(3,6)]原文demo:
y = np.where(y=='Iris-setosa',-1,1)>>array([-1, -1, -1, -1, -1, -1, -1, -1, -1, -1, -1, -1, -1, -1, -1, -1, -1,
-1, -1, -1, -1, -1, -1, -1, -1, -1, -1, -1, -1, -1, -1, -1, -1, -1,
-1, -1, -1, -1, -1, -1, -1, -1, -1, -1, -1, -1, -1, -1, -1, 1, 1,
1, 1, 1, 1, 1, 1, 1, 1, 1, 1, 1, 1, 1, 1, 1, 1, 1,
1, 1, 1, 1, 1, 1, 1, 1, 1, 1, 1, 1, 1, 1, 1, 1, 1,
1, 1, 1, 1, 1, 1, 1, 1, 1, 1, 1, 1, 1, 1, 1])语法介绍:
知识点3:numpy.meshgrid()
原文代码:
def plot_decision_regions(X,y,classifier,resolution=0.02):
    markers = ('s','x','o','^','v')
    colors = ('red','blue','lightgreen','gray','cyan')
    cmap = ListedColormap(colors[:len(np.unique(y))])
    x1_min,x1_max = X[:,0].min()-1,X[:,0].max()+1
    x2_min,x2_max = X[:,1].min()-1,X[:,1].max()+1
    xx1,xx2 = np.meshgrid(np.arange(x1_min,x1_max,resolution),np.arange(x2_min,x2_max,resolution))
    z = classifier.predict(np.array([xx1.ravel(),xx2.ravel()]).T)
作用:从坐标向量返回坐标矩阵。
eg:
x = np.arange(-2,2)
y = np.arange(0,3)#生成一位数组,其实也就是向量

x
Out[31]: array([-2, -1,  0,  1])

y
Out[32]: array([0, 1, 2])

z,s = np.meshgrid(x,y)#将两个一维数组变为二维矩阵

z
Out[36]:
array([[-2, -1,  0,  1],
       [-2, -1,  0,  1],
       [-2, -1,  0,  1]])

s
Out[37]:
array([[0, 0, 0, 0],
       [1, 1, 1, 1],
       [2, 2, 2, 2]])
知识点4:numpy.ravel() 与numpy.flatten()
原文代码:
def plot_decision_regions(X,y,classifier,resolution=0.02):
    markers = ('s','x','o','^','v')
    colors = ('red','blue','lightgreen','gray','cyan')
    cmap = ListedColormap(colors[:len(np.unique(y))])
    x1_min,x1_max = X[:,0].min()-1,X[:,0].max()+1
    x2_min,x2_max = X[:,1].min()-1,X[:,1].max()+1
    xx1,xx2 = np.meshgrid(np.arange(x1_min,x1_max,resolution),np.arange(x2_min,x2_max,resolution))
    z = classifier.predict(np.array([xx1.ravel(),xx2.ravel()]).T)
二者都是将多维数组降位一维,
区别:numpy.flatten()返回一份拷贝,对拷贝所做的修改不会影响(reflects)原始矩阵,
numpy.ravel()返回的是视图(view,也颇有几分C/C++引用reference的意味),会影响(reflects)原始矩阵。
两者默认均是行序优先
In [1]: import numpy as np
In [2]:x=np.array([[1,2],[3,4],[5,6]])
In [3]:x
Out[3]:
array([[1, 2], [3, 4], [5, 6]])
In [4]:x.flatten()
Out[4]:array([1, 2, 3, 4, 5, 6])
In [7]:x.ravel()
Out[7]:array([1, 2, 3, 4, 5, 6])
In [8]:x.flatten('F')
Out[8]:array([1, 3, 5, 2, 4, 6])
In[8]:x.flatten('F')
Out[8]: array([1, 3, 5, 2, 4, 6])

In[9]:x.ravel('F')
Out[9]: array([1, 3, 5, 2, 4, 6])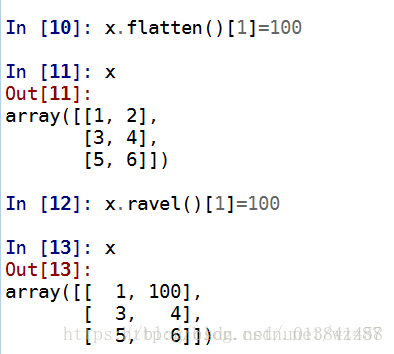
知识点5:Numpy中转置transpose、T和swapaxes
原文代码同上
eg
In [1]: import numpy as np

In [2]: arr=np.arange(16).reshape(2,2,4)

In [3]: arr
Out[3]:
array([[[ 0,  1,  2,  3],
        [ 4,  5,  6,  7]],

       [[ 8,  9, 10, 11],
        [12, 13, 14, 15]]])
现在要进行装置transpose操作,比如
In [4]: arr.transpose(1,0,2)
Out[4]:
array([[[ 0,  1,  2,  3],
        [ 8,  9, 10, 11]],

       [[ 4,  5,  6,  7],
        [12, 13, 14, 15]]])
其中第一列是值,第二列是转置前位置,第三列是转置后,看到转置后位置,
ndarray的T属性,用法则比较简单,只需要在数组后跟.T即可。.T属性实际是转置里面的特殊情况,即不指定转置规则的默认规则。
#一维数组转置
>>> arr = np.arange(6)
>>> print arr
[0, 1, 2, 3, 4, 5]
>>> print arr.T
[0, 1, 2, 3, 4, 5]#一维还是一维…
#二维数组转置
>>> arr = np.arange(6).reshape((2,3))
>>> print arr
[[0, 1, 2],
[3, 4, 5]]
>>> print arr.T
[[0,3],
[1,4],
[3,5]]
#三维数组的转置
>>> arr = np.arange(24).reshape((2,3,4))
>>> print arr
[[[ 0, 1, 2, 3],
[ 4, 5, 6, 7],
[ 8, 9, 10, 11]],
[[ 12, 13, 14, 15],
[ 16, 17, 18, 19],
[ 20, 21, 22, 23]]]
>>> print arr.T
[[[0, 12],
[4, 16],
[8, 20]],
[[1, 13],
[5, 17],
[9, 21]],
[[2, 14],
[6, 18],
[10, 22]],
[[3, 15],
[7, 19],
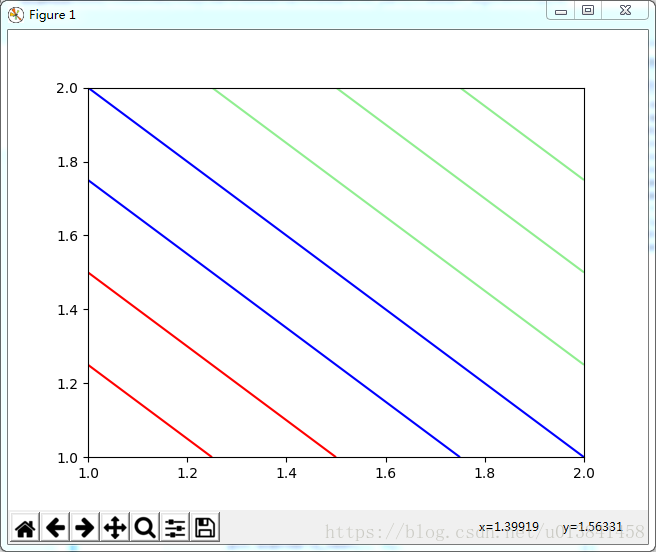
[11, 23]]]知识点6: Python可视化库matplotlib.pyplot里contour与contourf的区别
原文代码:
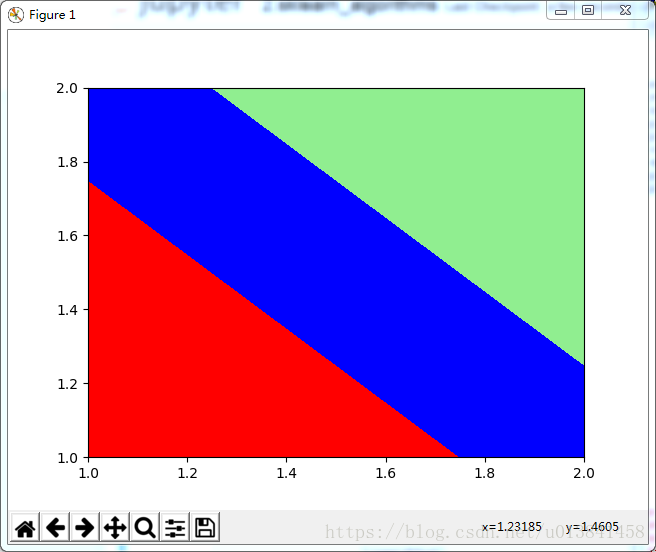
plt.contourf(xx1, xx2, Z, alpha=0.3, cmap=cmap)contour和contourf都是画三维等高线图的,不同点在于contourf会对等高线间的区域进行填充,区别如下:
import numpy as np
import matplotlib.pyplot as plt
from matplotlib.colors import ListedColormap
x=np.array([1,2])
y=np.array([1,2])
z=np.array([[1,2],[2,3]])
plt.xlim(1,2)
plt.ylim(1,2)
colors = ('red', 'blue', 'lightgreen', 'gray', 'cyan')
cmap = ListedColormap(colors[:len(np.unique(z))])
plt.contourf(x,y,z,cmap=cmap)   ###
plt.show()
import numpy as np
import matplotlib.pyplot as plt
from matplotlib.colors import ListedColormap
x=np.array([1,2])
y=np.array([1,2])
z=np.array([[1,2],[2,3]])
plt.xlim(1,2)
plt.ylim(1,2)
colors = ('red', 'blue', 'lightgreen', 'gray', 'cyan')
cmap = ListedColormap(colors[:len(np.unique(z))])
plt.contour(x,y,z,cmap=cmap)   ###
plt.show()
知识点7:plt.xlim()
原文代码:
 plt.xlim(xx1.min(), xx1.max())
plt.ylim(xx2.min(), xx2.max())知识点8:python中enumerate()的用法
原文代码:
for idx, cl in enumerate(np.unique(y)):
        plt.scatter(x=X[y == cl, 0],
                    y=X[y == cl, 1],
                    alpha=0.8,
                    c=colors[idx],
                    marker=markers[idx],
                    label=cl,
                    edgecolor='black')
enumerate() 函数用于将一个可遍历的数据对象(如列表、元组或字符串)组合为一个索引序列,同时列出数据和数据下标,一般用在 for 循环当中。
语法:
以下是 enumerate() 方法的语法:
enumerate(sequence, [start=0])
参数:
sequence -- 一个序列、迭代器或其他支持迭代对象。
start -- 下标起始位置。
普通的 for 循环
>>>i = 0
>>> seq = ['one', 'two', 'three']
>>> for element in seq:
...     print i, seq[i]
...     i +=1
...
0 one
1 two
2 three
for 循环使用 enumerate
>>>seq = ['one', 'two', 'three']
>>> for i, element in enumerate(seq):
...     print i, element
...
0 one
1 two
2 three
知识点9:numpy unique()
原文代码同上
eg
unique()保留数组中不同的值,返回两个参数。
>>> a=np.random.randint(0,5,8)
>>> a
array([2, 3, 3, 0, 1, 4, 2, 4])


>>> np.unique(a)
array([0, 1, 2, 3, 4])


>>> c,s=np.unique(b,return_index=True)
>>> c
array([0, 1, 2, 3, 4])
>>> s
array([3, 4, 0, 1, 5])(元素出现的起始位置) #当nrow=2,nclos=2时,代表fig画布被分为四个区域,axs[0][0]表示第一行第一个区域
知识点11:numpy.std() 求标准差numpy.mean() 求平均值
知识点12:plt.tight_layout() # 紧凑显示图片,居中显示
知识点13:numpy.random.seed()的使用
seed( ) 用于指定随机数生成时所用算法开始的整数值,如果使用相同的seed( )值,则每次生成的随即数都相同,如果不设置这个值,则系统根据时间来自己选择这个值,此时每次生成的随机数因时间差异而不同。
原文demo:
class AdalineSGD(object):
    def __init__(self,aphla=0.01,epoch=10,shuffle=True,random_state=None):
        self.aphla = aphla
        self.epoch = epoch
        self.w_initialized = False
        self.shuffle = shuffle
        if random_state:
            seed(random_state)
eg
编写如下第一份代码:
from numpy import *
num=0
while(num<5):
    random.seed(5)
    print(random.random())
    num+=1
运行结果为:
0.22199317108973948
0.22199317108973948
0.22199317108973948
0.22199317108973948
0.22199317108973948- 每次运行的结果都是一样的
修改代码,如下为第二份代码:
from numpy import *
num=0
random.seed(5)
while(num<5):
    print(random.random())
    num+=1
运行结果为:
0.22199317108973948
0.8707323061773764
0.20671915533942642
0.9186109079379216
0.48841118879482914
可以看到,和上一份代码的运行结果不同。这里每次的输出结果都是不一样的。这也就提醒了我们在以后编写代码的时候要明白一点:random.seed(something)只能是一次有效。
知识点13:Numpy.random中shuffle与permutation的区别
原文代码:
  def _shuffle(self,X,y):
r = np.random.permutation(len(y))函数shuffle与permutation都是对原来的数组进行重新洗牌(即随机打乱原来的元素顺序);区别在于shuffle直接在原来的数组上进行操作,改变原来数组的顺序,无返回值。而permutation不直接在原来的数组上进行操作,而是返回一个新的打乱顺序的数组,并不改变原来的数组。
示例:
a = np.arange(12)
print a
np.random.shuffle(a)
print a
print
a = np.arange(12)
print a
b = np.random.permutation(a)
print b
print a
输出:
[ 0  1  2  3  4  5  6  7  8  9 10 11]
[11  6  4 10  3  0  7  1  9  2  5  8]

[ 0  1  2  3  4  5  6  7  8  9 10 11]
[10  4  8 11  1  7  6  2  0  9  5  3]
[ 0  1  2  3  4  5  6  7  8  9 10 11]