在使用matlab画图时,有的时候,需要使用subplot,产生几十张图片一起看,比如下面程序:
clc;
clear;
close all;
warning off;


y(:,1) = rand(100,1);
y(:,2) = rand(100,1);
y(:,3) = rand(100,1);
y(:,4) = rand(100,1);
y(:,5) = rand(100,1);
y(:,6) = rand(100,1);
y(:,7) = rand(100,1);
y(:,8) = rand(100,1);
y(:,9) = rand(100,1);


figure;
subplot(3,3,1);plot(y(:,1));title('y1');
subplot(3,3,2);plot(y(:,2));title('y2');
subplot(3,3,3);plot(y(:,3));title('y3');
subplot(3,3,4);plot(y(:,4));title('y4');
subplot(3,3,5);plot(y(:,5));title('y5');
subplot(3,3,6);plot(y(:,6));title('y6');
subplot(3,3,7);plot(y(:,7));title('y7');
subplot(3,3,8);plot(y(:,8));title('y8');
subplot(3,3,9);plot(y(:,9));title('y9');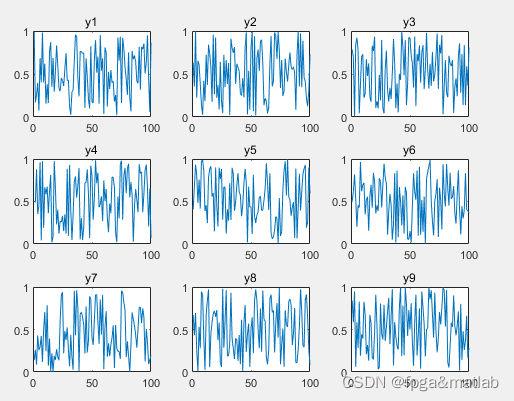
可以看到,产生9个图,但是当产生的图很多,那么上面这种编程方式就很麻烦,修改起来也十分不方便。
这里介绍一种简单的for循环产生方式,代码如下:
clc;
clear;
close all;
warning off;


y(:,1) = rand(100,1);
y(:,2) = rand(100,1);
y(:,3) = rand(100,1);
y(:,4) = rand(100,1);
y(:,5) = rand(100,1);
y(:,6) = rand(100,1);
y(:,7) = rand(100,1);
y(:,8) = rand(100,1);
y(:,9) = rand(100,1);

figure;
for i = 1:9
    subplot(3,3,i);plot(y(:,i));title(['y',num2str(i)]);
end
通过for循环,一句话就可以产生九个图了,注意,title这里,标题需要改写为:['y',num2str(i)],这样,y的小标就可以随着i自动变化了。