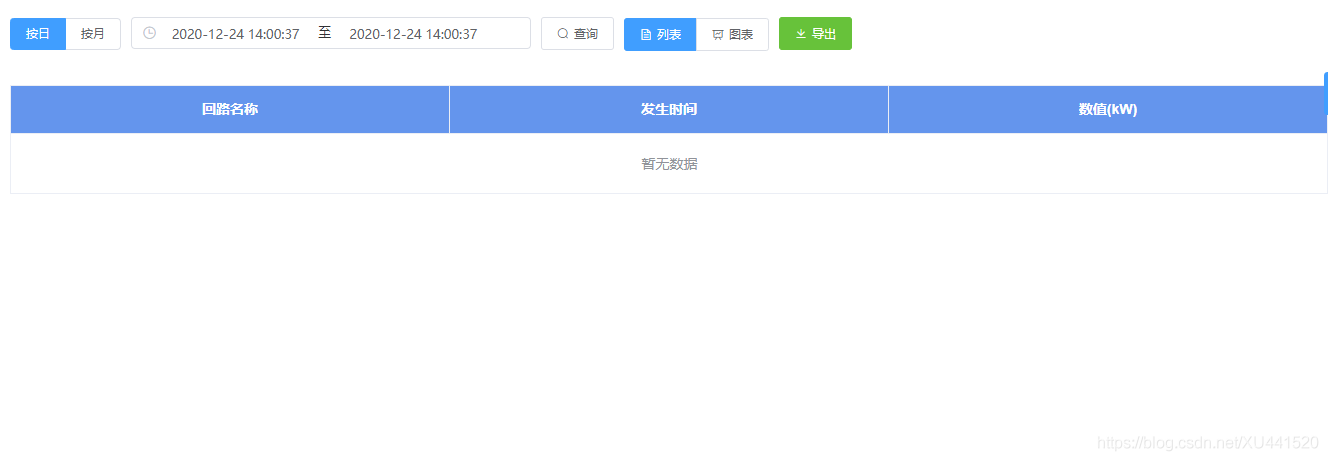
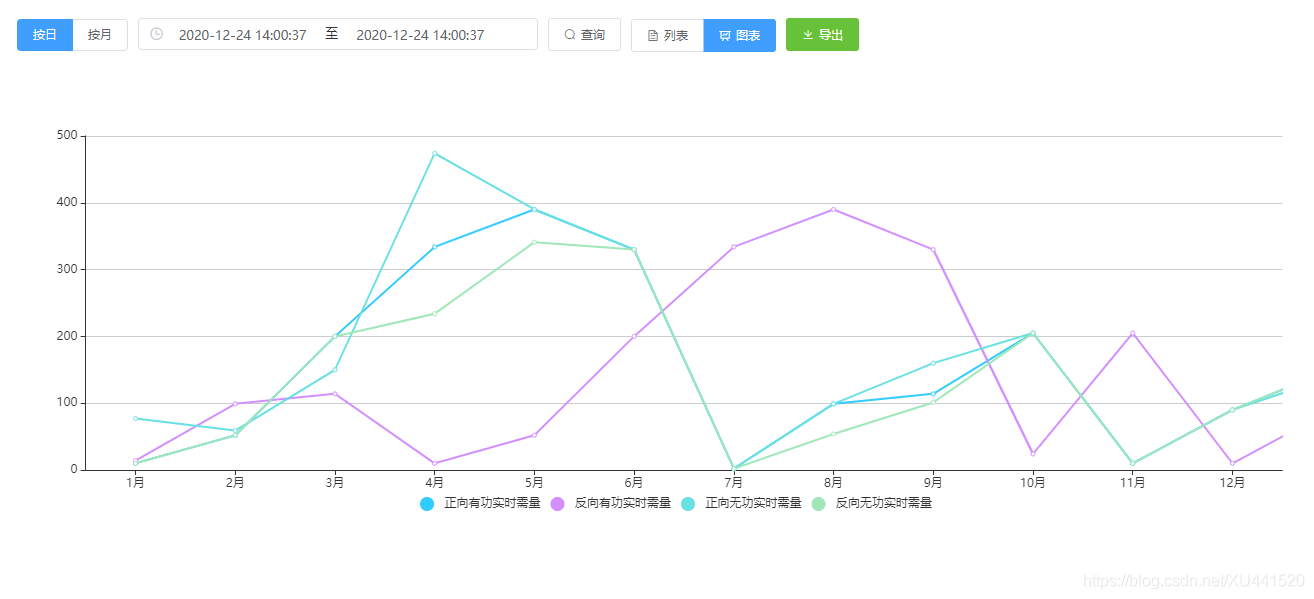
目标需求:我既要看表格数据,也要看对应的曲线
效果:(1)
(2)
代码:
js如下
 data() {
    return {
        buttonList: "primary",//默认显示表格
        buttonChart: "",//默认图形不显示
        legendData: ['正向有功实时需量','反向有功实时需量','正向无功实时需量','反向无功实时需量'],
        tableData: [],
        }
 },
 methods: {
    //图表
    handleList(){
      this.buttonList = "primary";
      this.buttonChart = "";
    },

    //柱状图
    handleChart() {
      this.buttonList = "";
      this.buttonChart = "primary";
      this.$nextTick(()=>{
        this.drawRealDemandLine();
      })
    },
    //柱形图
    drawRealDemandLine() {
      // 基于准备好的dom,初始化echarts实例
       let myChart1 = this.$echarts.init(
          document.getElementById("orderStatistics"),
          "light"
        ),
        option = {
          color: ["#3398DB"],
          tooltip: {
            trigger: "axis",
            axisPointer: {
              type: "shadow"
            },
          },
          grid: {
            left: "3%",
            right: "4%",
            bottom: "3%",
            containLabel: true,
          },
          color: ["#33CCFF", "#D28EFF"],
          legend: {
            icon: 'circle',
            bottom: 10,
            left: "center",
            data: this.legendData
          },
          grid: {
            left: "3%",
            right: "4%",
            bottom: "8%",
            containLabel: true,
          },
          xAxis: [
            {
              type: "category",
              data: [
                "1月",
                "2月",
                "3月",
                "4月",
                "5月",
                "6月",
                "7月",
                "8月",
                "9月",
                "10月",
                "11月",
                "12月",
              ],
              axisTick: {
                alignWithLabel: true,
              },
            },
          ],
          yAxis: [
            {
              type: "value",
            },
          ],
          series: [
            {
              name: this.legendData[0],
              type: "line",
              barWidth: "30%",
              data: [
                10,
                52,
                200,
                334,
                390,
                330,
                2,
                99,
                114,
                205,
                10,
                90,
                150,
                220,
              ],
            },
            {
              name: this.legendData[1],
              type: "line",
              barWidth: "30%",
              data: [
                14,
                99,
                114,
                10,
                52,
                200,
                334,
                390,
                330,
                24,
                205,
                10,
                90,
                150,
              ],
            },
            {
              name: this.legendData[2],
              type: "line",
              barWidth: "30%",
              data: [
                77,
                59,
                150,
                474,
                390,
                330,
                2,
                99,
                160,
                205,
                10,
                90,
                140,
                220,
              ],
            },
            {
              name: this.legendData[3],
              type: "line",
              barWidth: "30%",
              data: [
                10,
                52,
                200,
                234,
                341,
                330,
                2,
                54,
                101,
                205,
                10,
                90,
                150,
                200,
              ],
            },
          ],
        };
      // 绘制图表
      myChart1.setOption(option, true);
      window.onresize = function () {
        setTimeout(() => {
          myChart1.resize();
        }, 500);
      };
    },
},
主要html如下:
<el-form>
 <el-form-item>
   <el-button-group>
       <el-button size="small" :type="buttonList" icon="el-icon-document" @click="handleList">列表
       </el-button>
       <el-button size="small" :type="buttonChart" icon="el-icon-data-line" @click="handleChart">图表
       </el-button>
   </el-button-group>
 </el-form-item>
</el-form>
<!-- 图形 -->
<div
  v-if="buttonChart == 'primary'"
  id="orderStatistics"
  :style="{ width: '100%', height: '450px' }">
</div>
<!-- 表格 -->
<el-table
    v-if="buttonList == 'primary'"
    :data="tableData"
    border
    sum-text="合计"
    style="width: 100%; margin-top: 10px;"
    :header-cell-style="{ background: '#6495ED', color: '#fff' }"
>
    <el-table-column
        label="回路名称"
        prop="devname"
        header-align="center"
        align="center"
        :show-overflow-tooltip="true"
     ></el-table-column>
     <el-table-column
        label="发生时间"
        prop="dbtime"
        header-align="center"
        align="center"
     ></el-table-column>
     <el-table-column
        label="数值(kW)"
        prop="e"
        header-align="center"
        align="center"
     ></el-table-column>
</el-table>