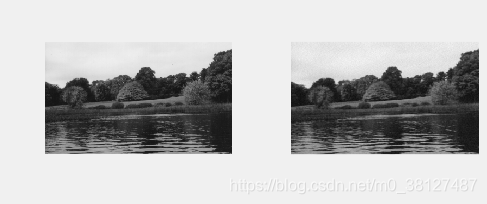
RGB = imread(‘autumn.tif’);%读取图像
I = rgb2gray(RGB);%转化为灰度图像
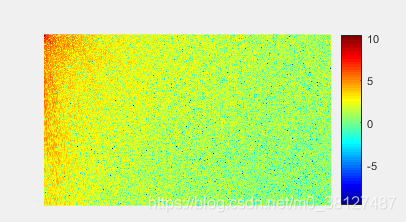
J = dct2(I);%离散余弦变换
figure,imshow(log(abs(J)),[]),%显示离散余弦变换的系数
colormap(jet(64)),
colorbar
J(abs(J) < 10) = 0;%置小系数为0
K = idct2(J);%离散余弦逆变换
figure,
subplot(121),imshow(I); subplot(122), imshow(K,[0 255])
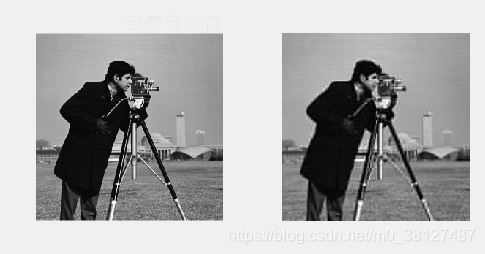
I = imread(‘cameraman.tif’);%读取图像
I = im2double(I);%转化为double型
T = dctmtx(8);% 的变换矩阵
dct = @(x)T * x * T’;%DCT变换公式
B = blkproc(I,[8 8],dct);%分块进行DCT变换
mask = [1 1 1 1 0 0 0 0
1 1 1 0 0 0 0 0
1 1 0 0 0 0 0 0
1 0 0 0 0 0 0 0
0 0 0 0 0 0 0 0
0 0 0 0 0 0 0 0
0 0 0 0 0 0 0 0
0 0 0 0 0 0 0 0];%DCT变换的小系数置为0
B2 = blkproc(B,[8 8],@(x)mask.* x);%分块选择DCT变换的系数
invdct = @(x)T’ * x * T;%DCT逆变换公式
I2 = blkproc(B2,[8 8],invdct);%分块重构
figure,
subplot(121),imshow(I), subplot(122), imshow(I2)
MATLAB图像变换三
猜你喜欢
转载自blog.csdn.net/m0_38127487/article/details/115185776
今日推荐
周排行