监控利器之Prometheus服务告警规则和dashboard配置(四)
接上篇监控利器之Prometheus服务监控(三),本篇主要讲解通过prometheus配置服务的告警规则和dashboard配置以及grafana创建用户
服务告警规则模板
1、mysql的告警规则模板
cd /home/monitor/prometheus  && mkdir rules
cd rules
cat mysql_status.yml
groups:
- name: MySQL_Monitor
  rules:
  - alert: MySQL is down
    expr: mysql_up == 0
    for: 1m
    labels:
      severity: critical
    annotations:
      summary: "Instance {

    { $labels.instance }} MySQL is down"
      description: "MySQL database is down. This requires immediate action!"
  - alert: open files high
    expr: mysql_global_status_innodb_num_open_files > (mysql_global_variables_open_files_limit) * 0.85
    for: 5m
    labels:
      severity: warning
    annotations:
      summary: "Instance {

    { $labels.instance }} open files high"
      description: "Open files is high. Please consider increasing open_files_limit."
  - alert: Mysql_High_QP
    expr: rate(mysql_global_status_questions[5m]) > 500
    for: 2m
    labels:
      severity: warning
    annotations:
      summary: "{

    {

    $labels.instance}}: Mysql_High_QPS detected"
      description: "{

    {

    $labels.instance}}: Mysql opreation is more than 500 per second ,(current value is: {

    { $value }})"
  - alert: Mysql_Too_Many_Connections
    expr: rate(mysql_global_status_threads_connected[5m]) > 200
    for: 2m
    labels:
      severity: warning
    annotations:
      summary: "{

    {

    $labels.instance}}: Mysql Too Many Connections detected"
      description: "{

    {

    $labels.instance}}: Mysql Connections is more than 100 per second ,(current value is: {

    { $value }})"
  - alert: Mysql_Too_Many_slow_queries
    expr: rate(mysql_global_status_slow_queries[5m]) > 3
    for: 2m
    labels:
      severity: warning
    annotations:
      summary: "{

    {

    $labels.instance}}: Mysql_Too_Many_slow_queries detected"
      description: "{

    {

    $labels.instance}}: Mysql slow_queries is more than 3 per second ,(current value is: {

    { $value }})"
  - alert: Read buffer size is bigger than max. allowed packet size
    expr: mysql_global_variables_read_buffer_size > mysql_global_variables_slave_max_allowed_packet
    for: 5m
    labels:
      severity: warning
    annotations:
      summary: "Instance {

    { $labels.instance }} Read buffer size is bigger than max. allowed packet size"
      description: "Read buffer size (read_buffer_size) is bigger than max. allowed packet size (max_allowed_packet).This can break your replication."
  - alert: Sort buffer possibly missconfigured
    expr: mysql_global_variables_innodb_sort_buffer_size <256*1024 or mysql_global_variables_read_buffer_size > 4*1024*1024
    for: 1m
    labels:
      severity: warning
    annotations:
      summary: "Instance {

    { $labels.instance }} Sort buffer possibly missconfigured"
      description: "Sort buffer size is either too big or too small. A good value for sort_buffer_size is between 256k and 4M."
  - alert: Thread stack size is too small
    expr: mysql_global_variables_thread_stack <196608
    for: 1m
    labels:
      severity: warning
    annotations:
      summary: "Instance {

    { $labels.instance }} Thread stack size is too small"
      description: "Thread stack size is too small. This can cause problems when you use Stored Language constructs for example. A typical is 256k for thread_stack_size."
  - alert: Used more than 80% of max connections limited
    expr: mysql_global_status_max_used_connections > mysql_global_variables_max_connections * 0.8
    for: 1m
    labels:
      severity: warning
    annotations:
      summary: "Instance {

    { $labels.instance }} Used more than 80% of max connections limited"
      description: "Used more than 80% of max connections limited"
  - alert: InnoDB Force Recovery is enabled
    expr: mysql_global_variables_innodb_force_recovery != 0
    for: 1m
    labels:
      severity: warning
    annotations:
      summary: "Instance {

    { $labels.instance }} InnoDB Force Recovery is enabled"
      description: "InnoDB Force Recovery is enabled. This mode should be used for data recovery purposes only. It prohibits writing to the data."
  - alert: InnoDB Log File size is too small
    expr: mysql_global_variables_innodb_log_file_size < 16777216
    for: 1m
    labels:
      severity: warning
    annotations:
      summary: "Instance {

    { $labels.instance }} InnoDB Log File size is too small"
      description: "The InnoDB Log File size is possibly too small. Choosing a small InnoDB Log File size can have significant performance impacts."
  - alert: InnoDB Flush Log at Transaction Commit
    expr: mysql_global_variables_innodb_flush_log_at_trx_commit != 1
    for: 1m
    labels:
      severity: warning
    annotations:
      summary: "Instance {

    { $labels.instance }} InnoDB Flush Log at Transaction Commit"
      description: "InnoDB Flush Log at Transaction Commit is set to a values != 1. This can lead to a loss of commited transactions in case of a power failure."
  - alert: Table definition cache too small
    expr: mysql_global_status_open_table_definitions > mysql_global_variables_table_definition_cache
    for: 1m
    labels:
      severity: page
    annotations:
      summary: "Instance {

    { $labels.instance }} Table definition cache too small"
      description: "Your Table Definition Cache is possibly too small. If it is much too small this can have significant performance impacts!"
  - alert: Table open cache too small
    expr: mysql_global_status_open_tables >mysql_global_variables_table_open_cache * 99/100
    for: 1m
    labels:
      severity: page
    annotations:
      summary: "Instance {

    { $labels.instance }} Table open cache too small"
      description: "Your Table Open Cache is possibly too small (old name Table Cache). If it is much too small this can have significant performance impacts!"
  - alert: Thread stack size is possibly too small
    expr: mysql_global_variables_thread_stack < 262144
    for: 1m
    labels:
      severity: page
    annotations:
      summary: "Instance {

    { $labels.instance }} Thread stack size is possibly too small"
      description: "Thread stack size is possibly too small. This can cause problems when you use Stored Language constructs for example. A typical is 256k for thread_stack_size."
  - alert: InnoDB Buffer Pool Instances is too small
    expr: mysql_global_variables_innodb_buffer_pool_instances == 1
    for: 1m
    labels:
      severity: page
    annotations:
      summary: "Instance {

    { $labels.instance }} InnoDB Buffer Pool Instances is too small"
      description: "If you are using MySQL 5.5 and higher you should use several InnoDB Buffer Pool Instances for performance reasons. Some rules are: InnoDB Buffer Pool Instance should be at least 1 Gbyte in size. InnoDB Buffer Pool Instances you can set equal to the number of cores of your machine."
  - alert: InnoDB Plugin is enabled
    expr: mysql_global_variables_ignore_builtin_innodb == 1
    for: 1m
    labels:
      severity: page
    annotations:
      summary: "Instance {

    { $labels.instance }} InnoDB Plugin is enabled"
      description: "InnoDB Plugin is enabled"
  - alert: Binary Log is disabled
    expr: mysql_global_variables_log_bin != 1
    for: 1m
    labels:
      severity: warning
    annotations:
      summary: "Instance {

    { $labels.instance }} Binary Log is disabled"
      description: "Binary Log is disabled. This prohibits you to do Point in Time Recovery (PiTR)."
  - alert: Binlog Cache size too small
    expr: mysql_global_variables_binlog_cache_size < 1048576
    for: 1m
    labels:
      severity: page
    annotations:
      summary: "Instance {

    { $labels.instance }} Binlog Cache size too small"
      description: "Binlog Cache size is possibly to small. A value of 1 Mbyte or higher is OK."
  - alert: Binlog Statement Cache size too small
    expr: mysql_global_variables_binlog_stmt_cache_size <1048576 and mysql_global_variables_binlog_stmt_cache_size > 0
    for: 1m
    labels:
      severity: page
    annotations:
      summary: "Instance {

    { $labels.instance }} Binlog Statement Cache size too small"
      description: "Binlog Statement Cache size is possibly to small. A value of 1 Mbyte or higher is typically OK."
  - alert: Binlog Transaction Cache size too small
    expr: mysql_global_variables_binlog_cache_size  <1048576
    for: 1m
    labels:
      severity: page
    annotations:
      summary: "Instance {

    { $labels.instance }} Binlog Transaction Cache size too small"
      description: "Binlog Transaction Cache size is possibly to small. A value of 1 Mbyte or higher is typically OK."
  - alert: Sync Binlog is enabled
    expr: mysql_global_variables_sync_binlog == 1
    for: 1m
    labels:
      severity: page
    annotations:
      summary: "Instance {

    { $labels.instance }} Sync Binlog is enabled"
      description: "Sync Binlog is enabled. This leads to higher data security but on the cost of write performance."
  - alert: IO thread stopped
    expr: mysql_slave_status_slave_io_running != 1
    for: 1m
    labels:
      severity: critical
    annotations:
      summary: "Instance {

    { $labels.instance }} IO thread stopped"
      description: "IO thread has stopped. This is usually because it cannot connect to the Master any more."
  - alert: SQL thread stopped
    expr: mysql_slave_status_slave_sql_running == 0
    for: 1m
    labels:
      severity: critical
    annotations:
      summary: "Instance {

    { $labels.instance }} SQL thread stopped"
      description: "SQL thread has stopped. This is usually because it cannot apply a SQL statement received from the master."
  - alert: SQL thread stopped
    expr: mysql_slave_status_slave_sql_running != 1
    for: 1m
    labels:
      severity: critical
    annotations:
      summary: "Instance {

    { $labels.instance }} Sync Binlog is enabled"
      description: "SQL thread has stopped. This is usually because it cannot apply a SQL statement received from the master."
  - alert: Slave lagging behind Master
    expr: rate(mysql_slave_status_seconds_behind_master[5m]) >30
    for: 1m
    labels:
      severity: warning
    annotations:
      summary: "Instance {

    { $labels.instance }} Slave lagging behind Master"
      description: "Slave is lagging behind Master. Please check if Slave threads are running and if there are some performance issues!"
  - alert: Slave is NOT read only(Please ignore this warning indicator.)
    expr: mysql_global_variables_read_only != 0
    for: 1m
    labels:
      severity: page
    annotations:
      summary: "Instance {

    { $labels.instance }} Slave is NOT read only"
      description: "Slave is NOT set to read only. You can accidentally manipulate data on the slave and get inconsistencies..."
2、es的告警规则模块
cd /home/monitor/prometheus/rules
cat es.yml
groups:
- name: elasticsearchStatsAlert
  rules:
  - alert: Elastic_Cluster_Health_RED
    expr: elasticsearch_cluster_health_status{

    color="red"}==1
    for: 1m
    labels:
      severity: critical
    annotations:
      summary: "Instance {

    { $labels.instance }}: not all primary and replica shards are allocated in elasticsearch cluster {

    { $labels.cluster }}"
      description: "Instance {

    { $labels.instance }}: not all primary and replica shards are allocated in elasticsearch cluster {

    { $labels.cluster }}."

  - alert: Elastic_Cluster_Health_Yellow
    expr: elasticsearch_cluster_health_status{

    color="yellow"}==1
    for: 1m
    labels:
      severity: critical
    annotations:
      summary: " Instance {

    { $labels.instance }}: not all primary and replica shards are allocated in elasticsearch cluster {

    { $labels.cluster }}"
      description: "Instance {

    { $labels.instance }}: not all primary and replica shards are allocated in elasticsearch cluster {

    { $labels.cluster }}."

  - alert: Elasticsearch_JVM_Heap_Too_High
    expr: elasticsearch_jvm_memory_used_bytes{

    area="heap"} / elasticsearch_jvm_memory_max_bytes{

    area="heap"} > 0.8
    for: 1m
    labels:
      severity: critical
    annotations:
      summary: "ElasticSearch node {

    { $labels.instance }} heap usage is high "
      description: "The heap in {

    { $labels.instance }} is over 80% for 15m."

  - alert: Elasticsearch_health_up
    expr: elasticsearch_cluster_health_up !=1
    for: 1m
    labels:
      severity: critical
    annotations:
      summary: " ElasticSearch node: {

    { $labels.instance }} last scrape of the ElasticSearch cluster health failed"
      description: "ElasticSearch node: {

    { $labels.instance }} last scrape of the ElasticSearch cluster health failed"

  - alert: Elasticsearch_Too_Few_Nodes_Running
    expr: elasticsearch_cluster_health_number_of_nodes < 10
    for: 1m
    labels:
      severity: critical
    annotations:
      summary: "There are only {

    {

    $value}} < 10 ElasticSearch nodes running "
      description: "lasticSearch running on less than 10 nodes(total 10)"

  - alert: Elasticsearch_Count_of_JVM_GC_Runs
    expr: rate(elasticsearch_jvm_gc_collection_seconds_count{

    }[5m])>5
    for: 1m
    labels:
      severity: critical
    annotations:
      summary: "ElasticSearch node {

    { $labels.instance }}: Count of JVM GC runs > 5 per sec and has a value of {

    { $value }} "
      description: "ElasticSearch node {

    { $labels.instance }}: Count of JVM GC runs > 5 per sec and has a value of {

    { $value }}"

  - alert: Elasticsearch_GC_Run_Time
    expr: rate(elasticsearch_jvm_gc_collection_seconds_sum[5m])>0.3
    for: 1m
    labels:
      severity: critical
    annotations:
      summary: " ElasticSearch node {

    { $labels.instance }}: GC run time in seconds > 0.3 sec and has a value of {

    { $value }}"
      description: "ElasticSearch node {

    { $labels.instance }}: GC run time in seconds > 0.3 sec and has a value of {

    { $value }}"

#  - alert: Elasticsearch_json_parse_failures
#    expr: elasticsearch_cluster_health_json_parse_failures>0
#    for: 1m
#    labels:
#      severity: critical
#    annotations:
#      summary: " ElasticSearch node {

    { $labels.instance }}: json parse failures > 0 and has a value of {

    { $value }}"
#      description: "ElasticSearch node {

    { $labels.instance }}: json parse failures > 0 and has a value of {

    { $value }}"

  - alert: Elasticsearch_breakers_tripped
    expr: rate(elasticsearch_breakers_tripped{

    }[5m])>0
    for: 1m
    labels:
      severity: critical
    annotations:
      summary: " ElasticSearch node {

    { $labels.instance }}: breakers tripped > 0 and has a value of {

    { $value }}"
      description: "ElasticSearch node {

    { $labels.instance }}: breakers tripped > 0 and has a value of {

    { $value }}"

  - alert: Elasticsearch_health_timed_out
    expr: elasticsearch_cluster_health_timed_out>0
    for: 1m
    labels:
      severity: critical
    annotations:
      summary: " ElasticSearch node {

    { $labels.instance }}: Number of cluster health checks timed out > 0 and has a value of {

    { $value }}"
      description: "ElasticSearch node {

    { $labels.instance }}: Number of cluster health checks timed out > 0 and has a value of {

    { $value }}"
3、node的告警规则模板(也可以合并)
1)cpu模板
cat cpu.yml
groups:
- name: cpu.rules
  rules:
  # Alert for any ×××tance that is unreachable for >5 minutes.
  - alert: NodeCpuUsage
    expr: 100-irate(node_cpu_seconds_total{

    job="node",mode="idle"}[5m])*100 > 1
    for: 1m
    labels:
      severity: error
    annotations:
      summary: "{

    { $labels.instance }} cpu useage load too high"
      description: "{

    { $labels.instance }} of job {

    { $labels.job }} has been too hgih for more than 1 minutes."
2)文件系统模板
cat file_sys.yml
groups:
- name: file_sys.rules
  rules:
  - alert: NodeFilesystemUsage
    expr: (node_filesystem_size{

    device="rootfs"} - node_filesystem_free{

    device="rootfs"}) / node_filesystem_size{

    device="rootfs"} * 100 > 80
    for: 2m
    labels:
      severity: error
    annotations:
      summary: "{

    {

    $labels.instance}}: High Filesystem usage detected"
      description: "{

    {

    $labels.instance}}: Filesystem usage is above 80% (current value is: {

    { $value }}"
3)内存模板
cat memory.yml
groups:
- name: mem.rules
  rules:
   - alert: NodeMemoryUsage
     expr: (node_memory_MemTotal_bytes - (node_memory_MemFree_bytes+node_memory_Buffers_bytes+node_memory_Cached_bytes )) / node_memory_MemTotal_bytes * 100 > 90
     for: 5m
     labels:
       severity: error
     annotations:
       summary: "Instance {

    { $labels.instance }} memory is too hight"
       description: "{

    { $labels.instance }} of job {

    { $labels.job }} has been down for more than 5 minutes."
4)节点存活模板
cat node_up.yml
groups:
- name: general.rules
  rules:
  - alert: InstanceDown
    expr: up == 0
    for: 1m
    labels:
      severity: error
    annotations:
      summary: "Instance {

    { $labels.instance }} down"
      description: "{

    { $labels.instance }} of job {

    { $labels.job }} has been down for more than 5 minutes."
5)合并后
groups:
- name: Host_Monitor
  rules:
  # Alert for any ×××tance that is unreachable for >5 minutes.
  - alert: NodeCpuUsage
    expr: 100-irate(node_cpu_seconds_total{

    job="node",mode="idle"}[5m])*100 > 1
    for: 1m
    labels:
      severity: error
    annotations:
      summary: "{

    { $labels.instance }} cpu useage load too high"
      description: "{

    { $labels.instance }} of job {

    { $labels.job }} has been too hgih for more than 1 minutes."

  - alert: NodeFilesystemUsage
    expr: (node_filesystem_size{

    device="rootfs"} - node_filesystem_free{

    device="rootfs"}) / node_filesystem_size{

    device="rootfs"} * 100 > 80
    for: 2m
    labels:
      severity: error
    annotations:
      summary: "{

    {

    $labels.instance}}: High Filesystem usage detected"
      description: "{

    {

    $labels.instance}}: Filesystem usage is above 80% (current value is: {

    { $value }}"

   - alert: NodeMemoryUsage
     expr: (node_memory_MemTotal_bytes - (node_memory_MemFree_bytes+node_memory_Buffers_bytes+node_memory_Cached_bytes )) / node_memory_MemTotal_bytes * 100 > 90
     for: 5m
     labels:
       severity: error
     annotations:
       summary: "Instance {

    { $labels.instance }} memory is too hight"
       description: "{

    { $labels.instance }} of job {

    { $labels.job }} has been down for more than 5 minutes."

  - alert: InstanceDown
    expr: up == 0
    for: 1m
    labels:
      severity: error
    annotations:
      summary: "Instance {

    { $labels.instance }} down"
      description: "{

    { $labels.instance }} of job {

    { $labels.job }} has been down for more than 5 minutes."
dashboard配置
1、下载grafana软件包和安装
wget https://dl.grafana.com/oss/release/grafana-6.4.3-1.x86_64.rpm
yum localinstall -y grafana-6.4.3-1.x86_64.rpm
systemctl start grafana-server
systemctl enable grafana-server
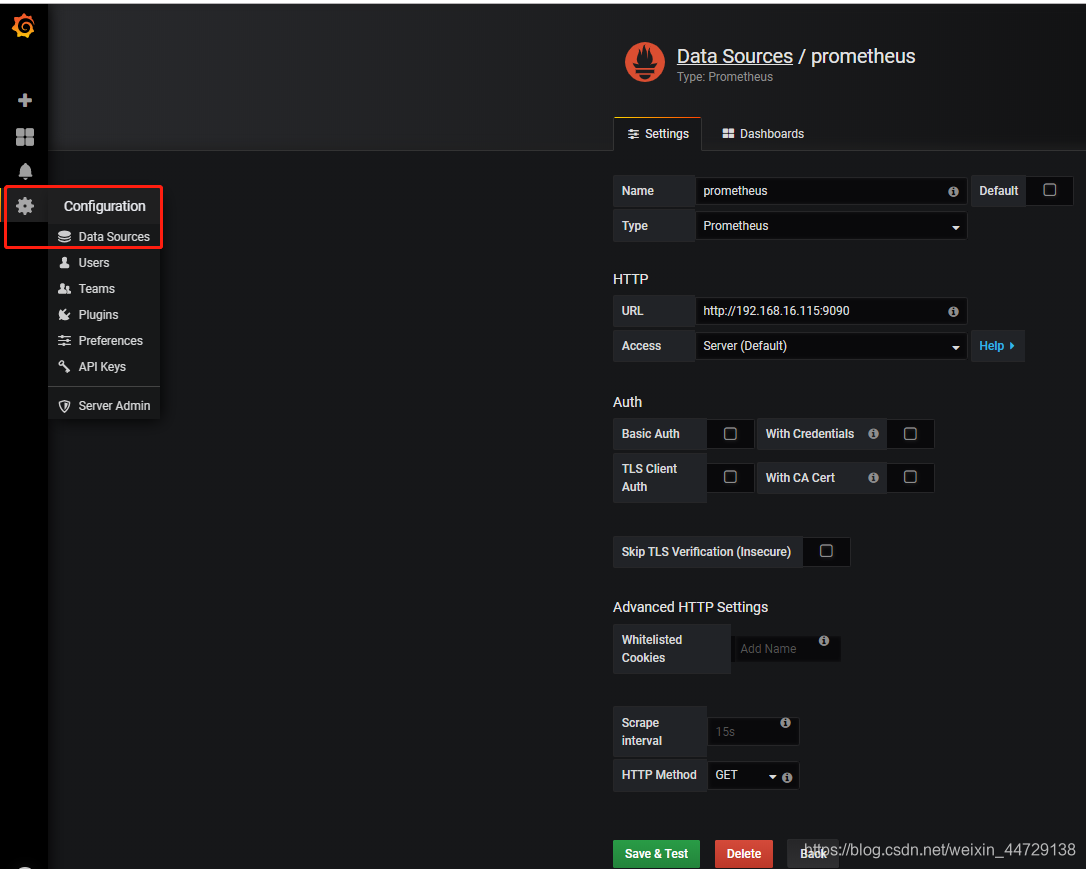
2、登录grafana和连接数据库
登录grafana
默认端口:3000
地址:http://ip:3000
初始管理员账号:admin,密码:admin
连接数据库
3、dashboard配置
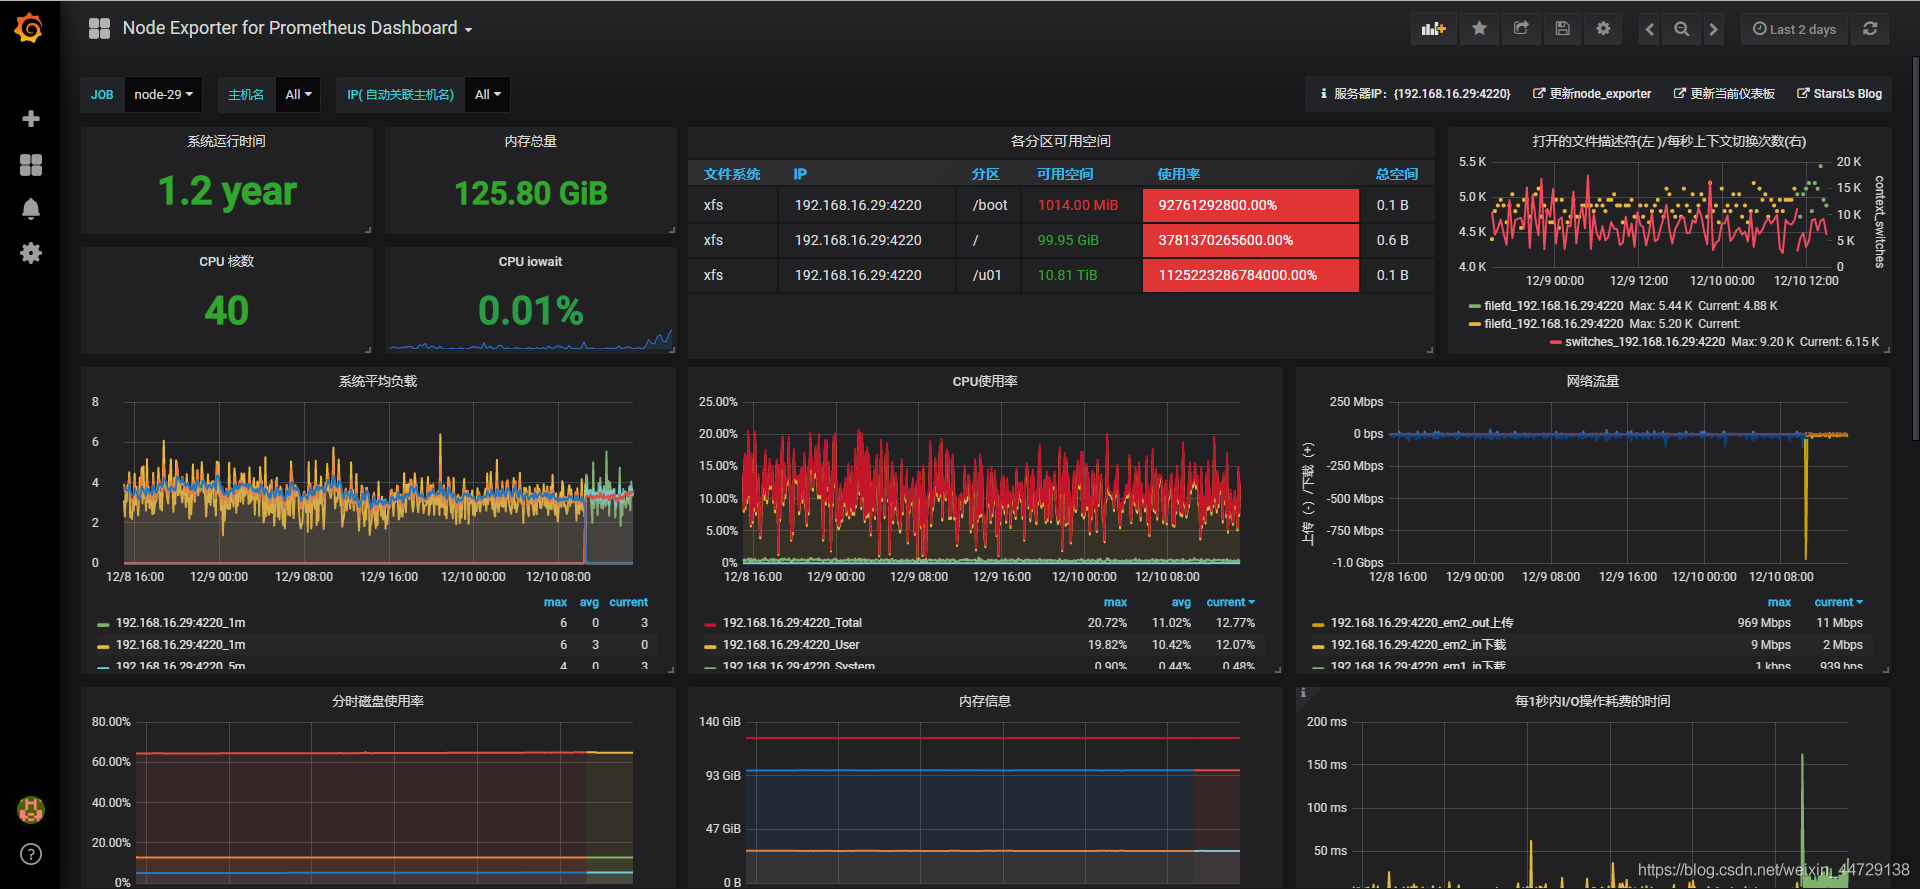
1)node dashboard
连接地址
https://grafana.com/grafana/dashboards?search=node%20export
https://grafana.com/grafana/dashboards/8919
搜索node的模板

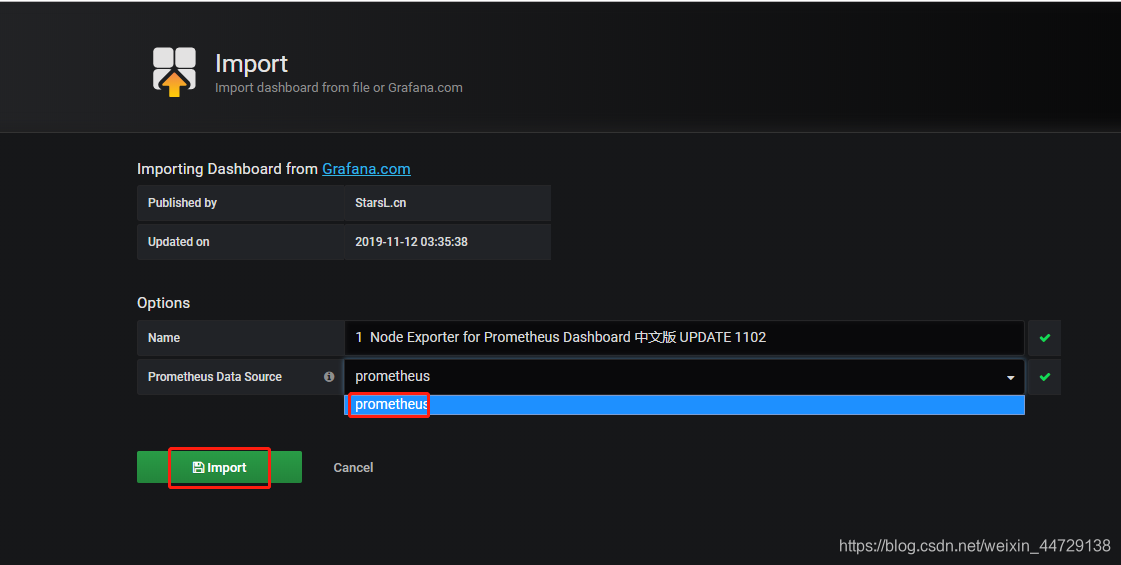
复制模板的id

粘贴id,导入模板
最终展示图
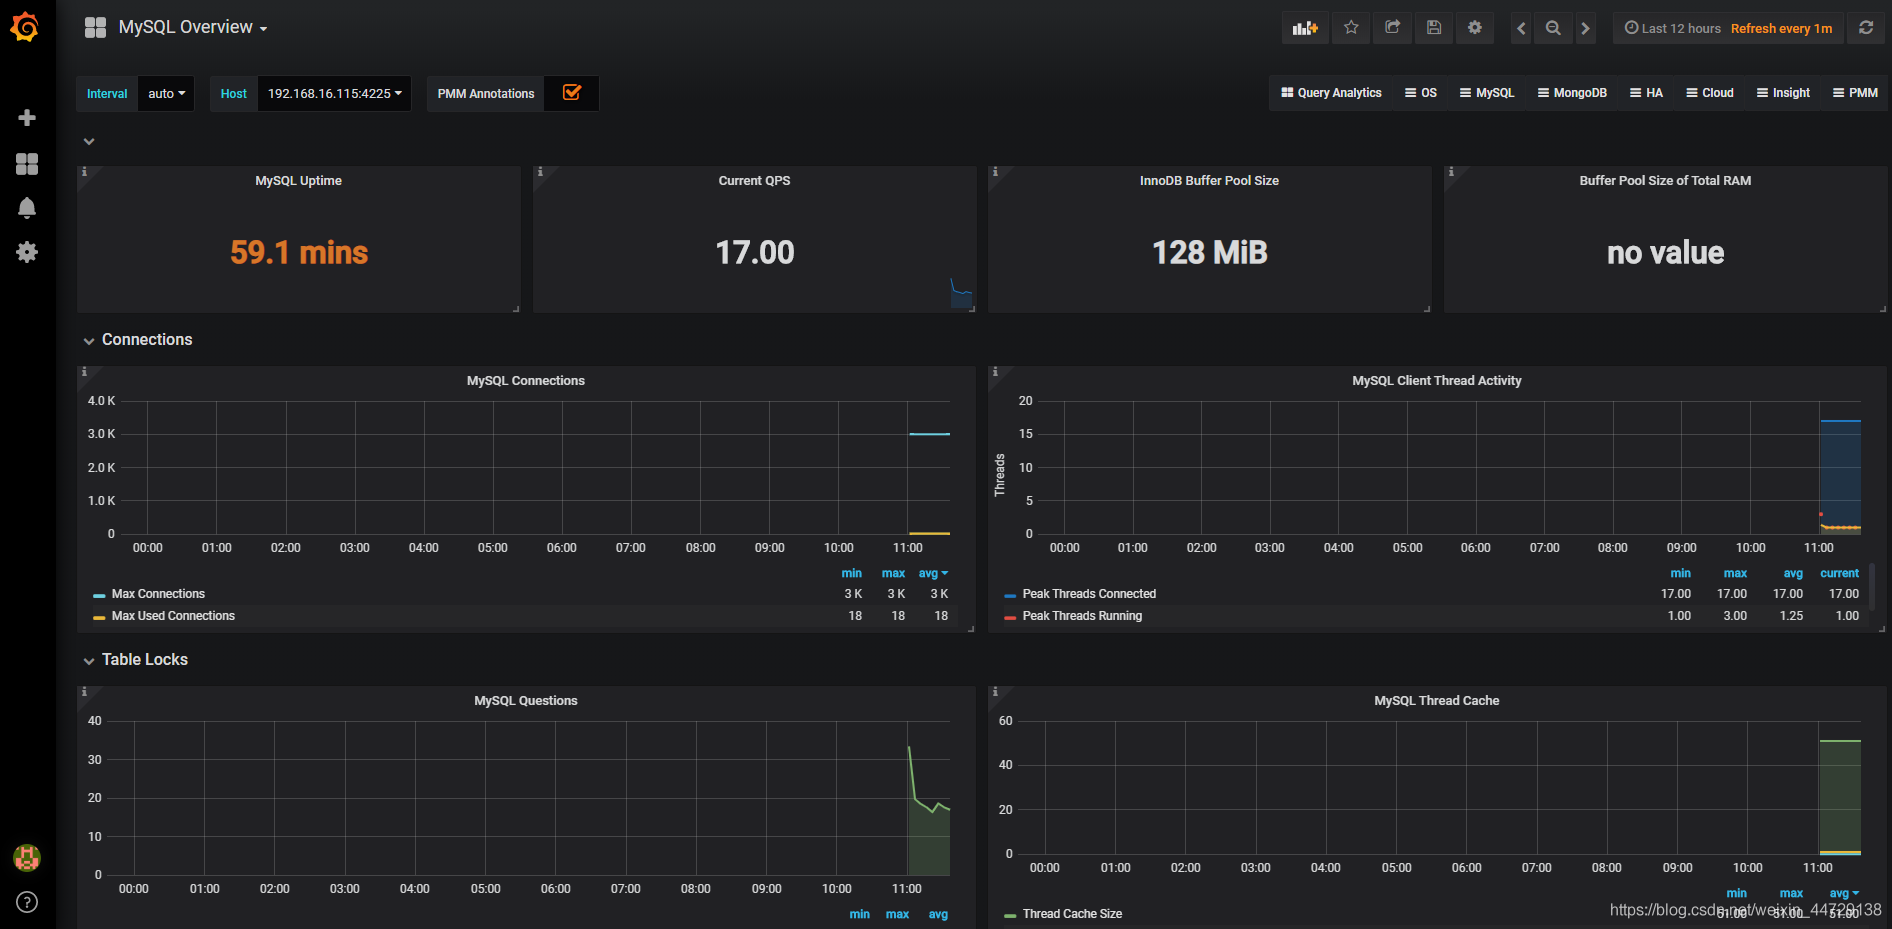
2)mysql dashboard
https://grafana.com/grafana/dashboards?search=Mysql%20over
https://grafana.com/dashboards/7362


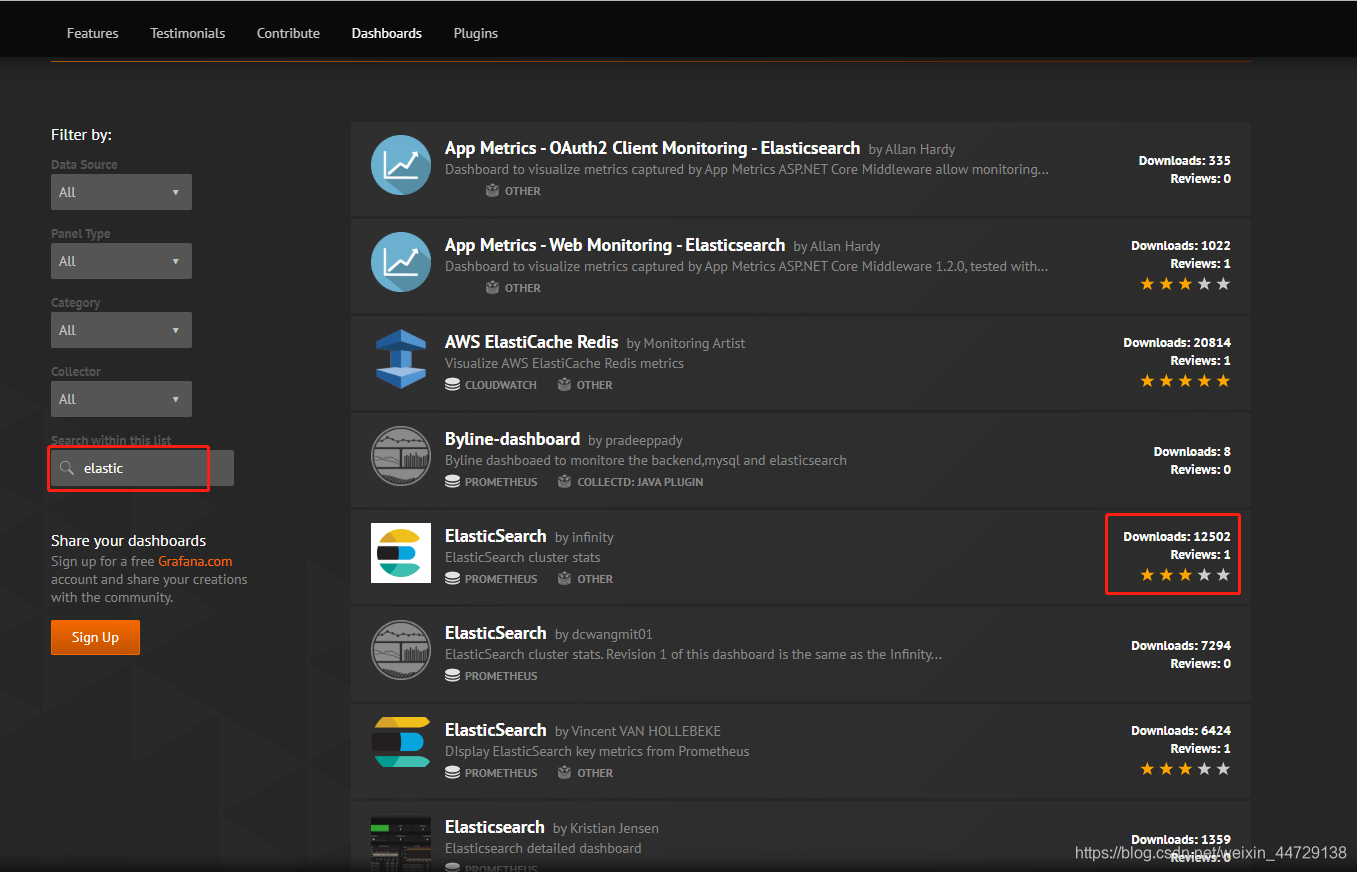
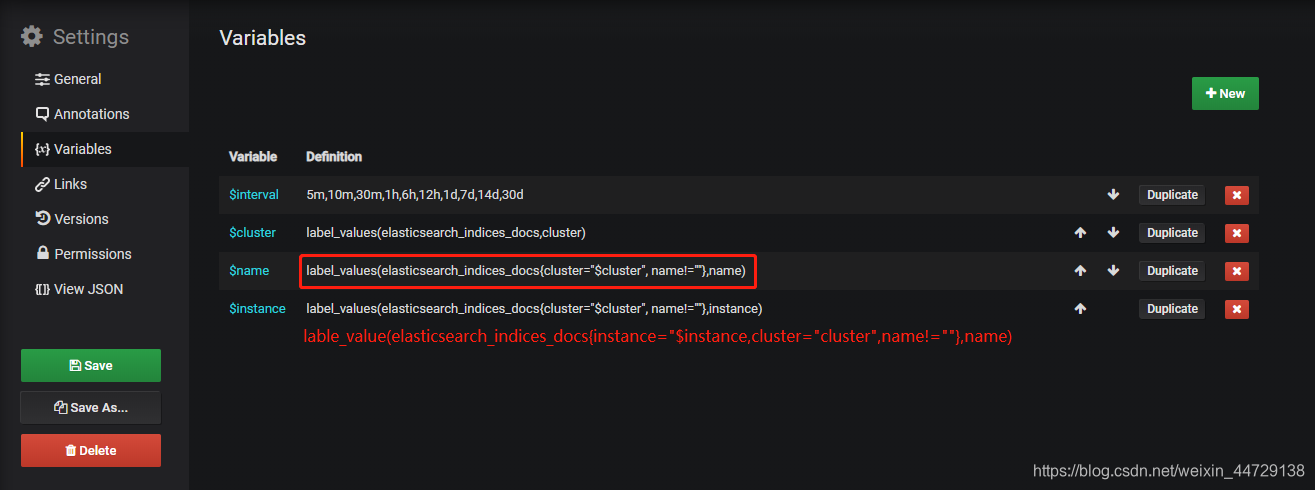
3)es dashboard
https://grafana.com/grafana/dashboards/6483(推荐使用)
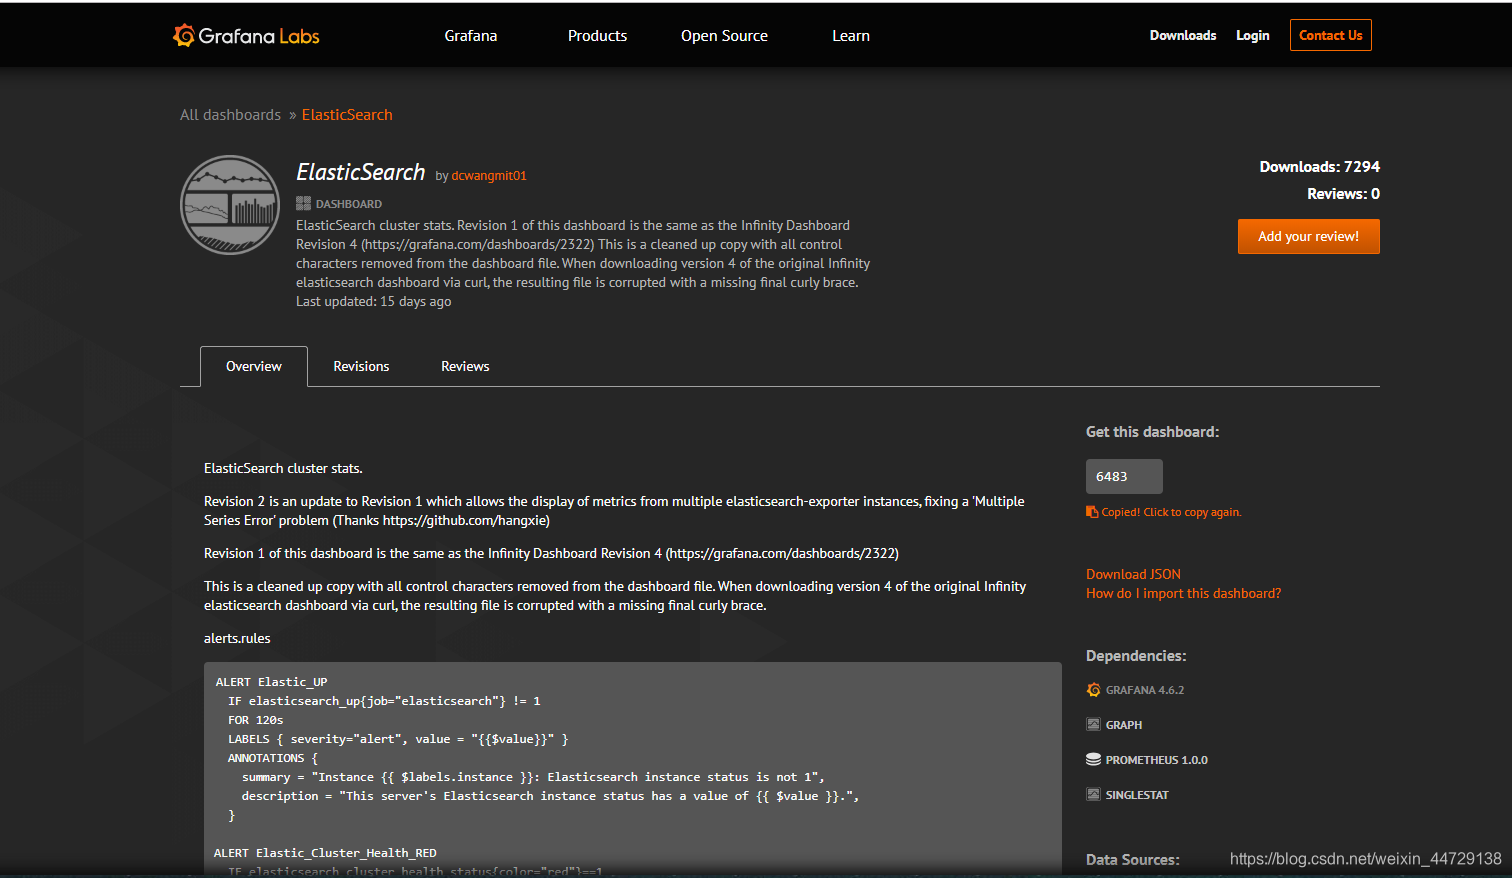
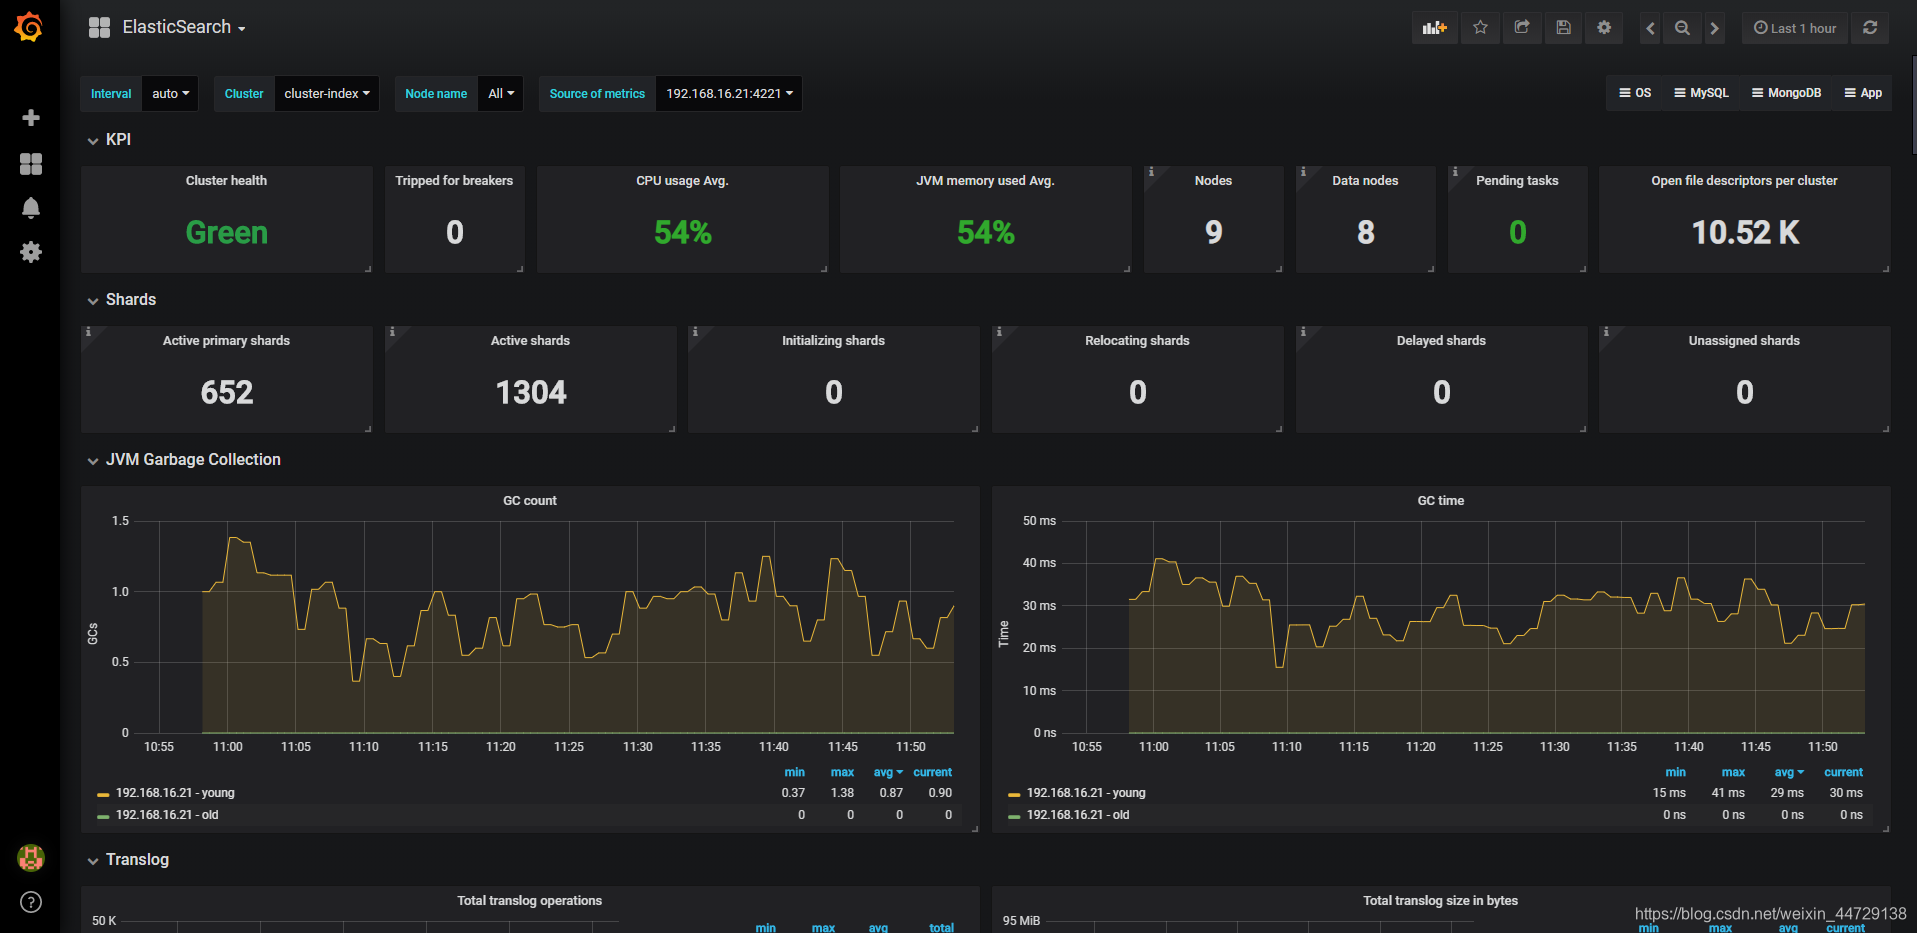
https://grafana.com/grafana/dashboards/2322(需要调整参数表达式)
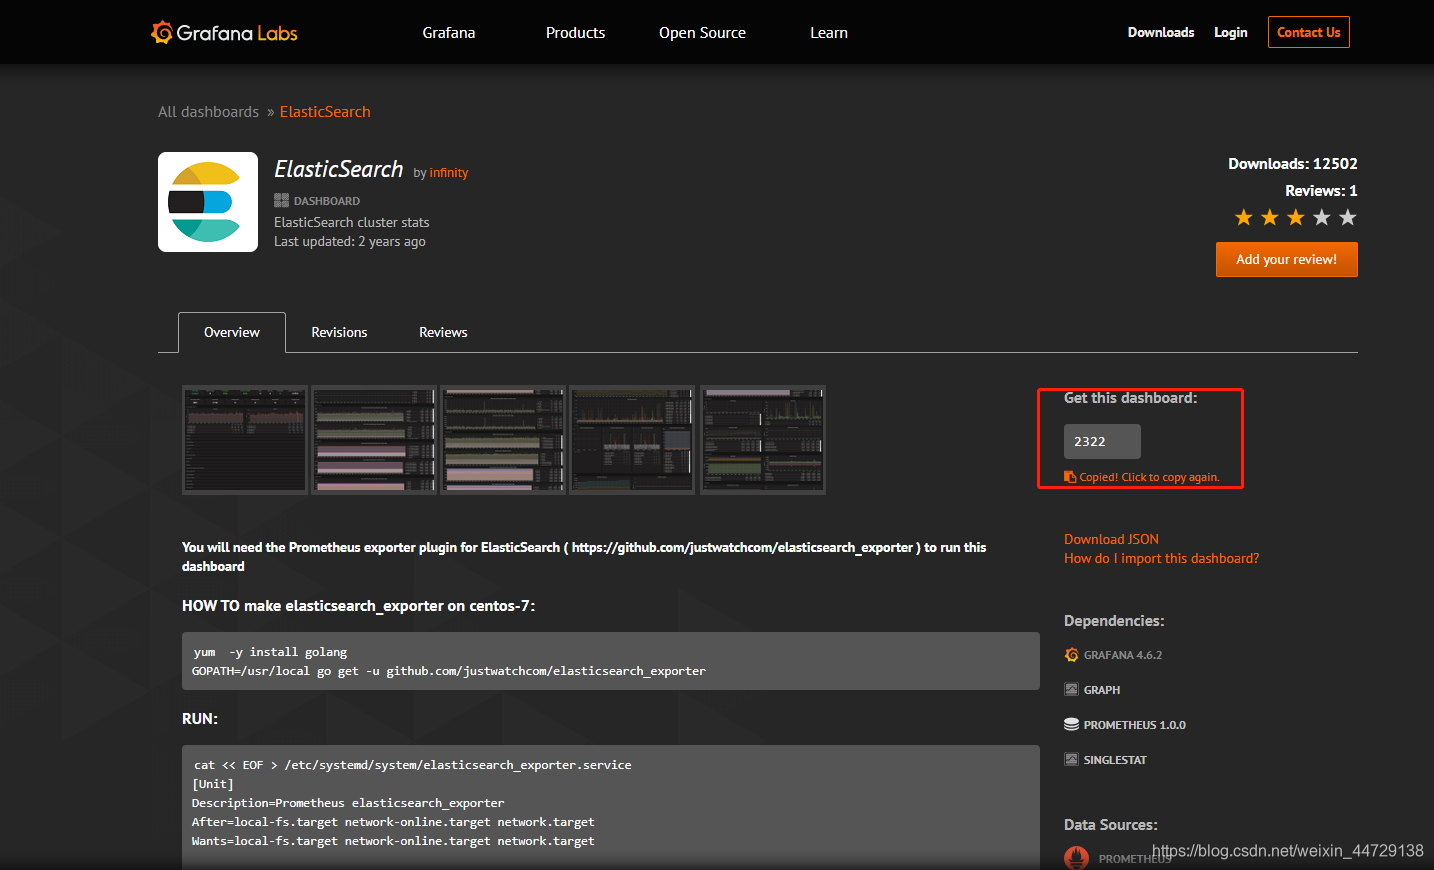
label_values(elasticsearch_indices_docs{

    instance="$instance",cluster="$cluster", name!=""},name)
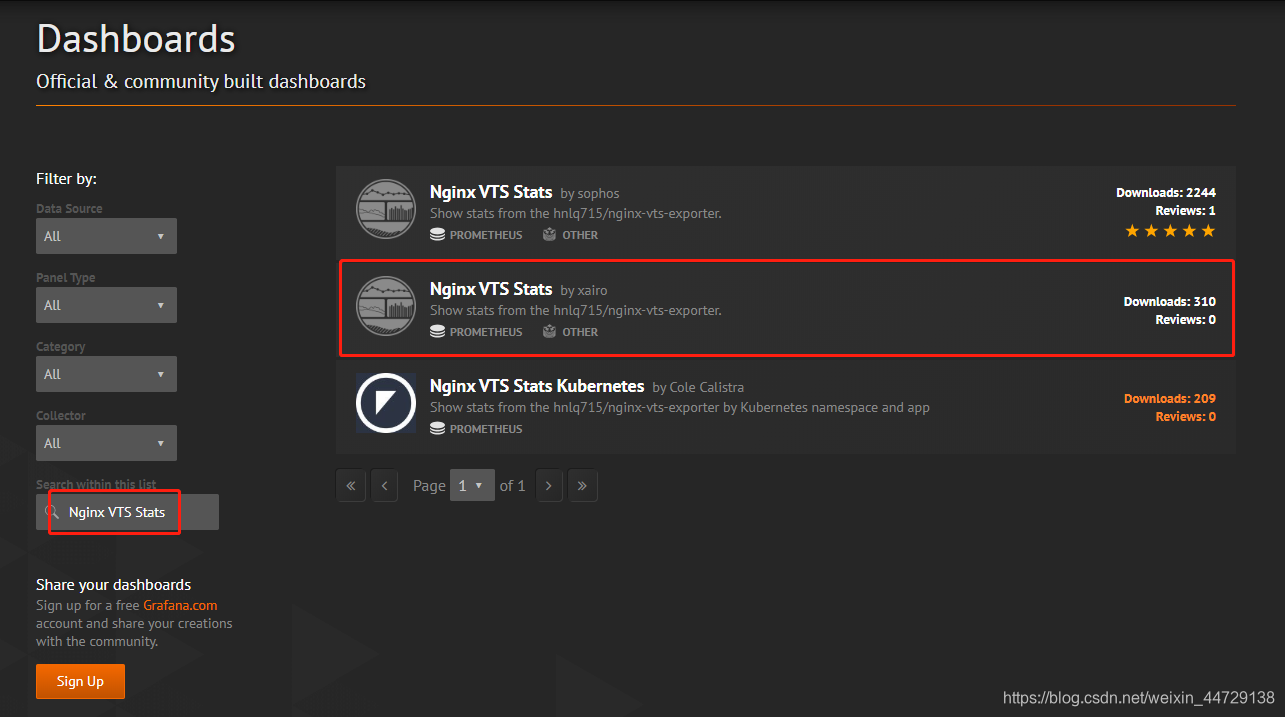
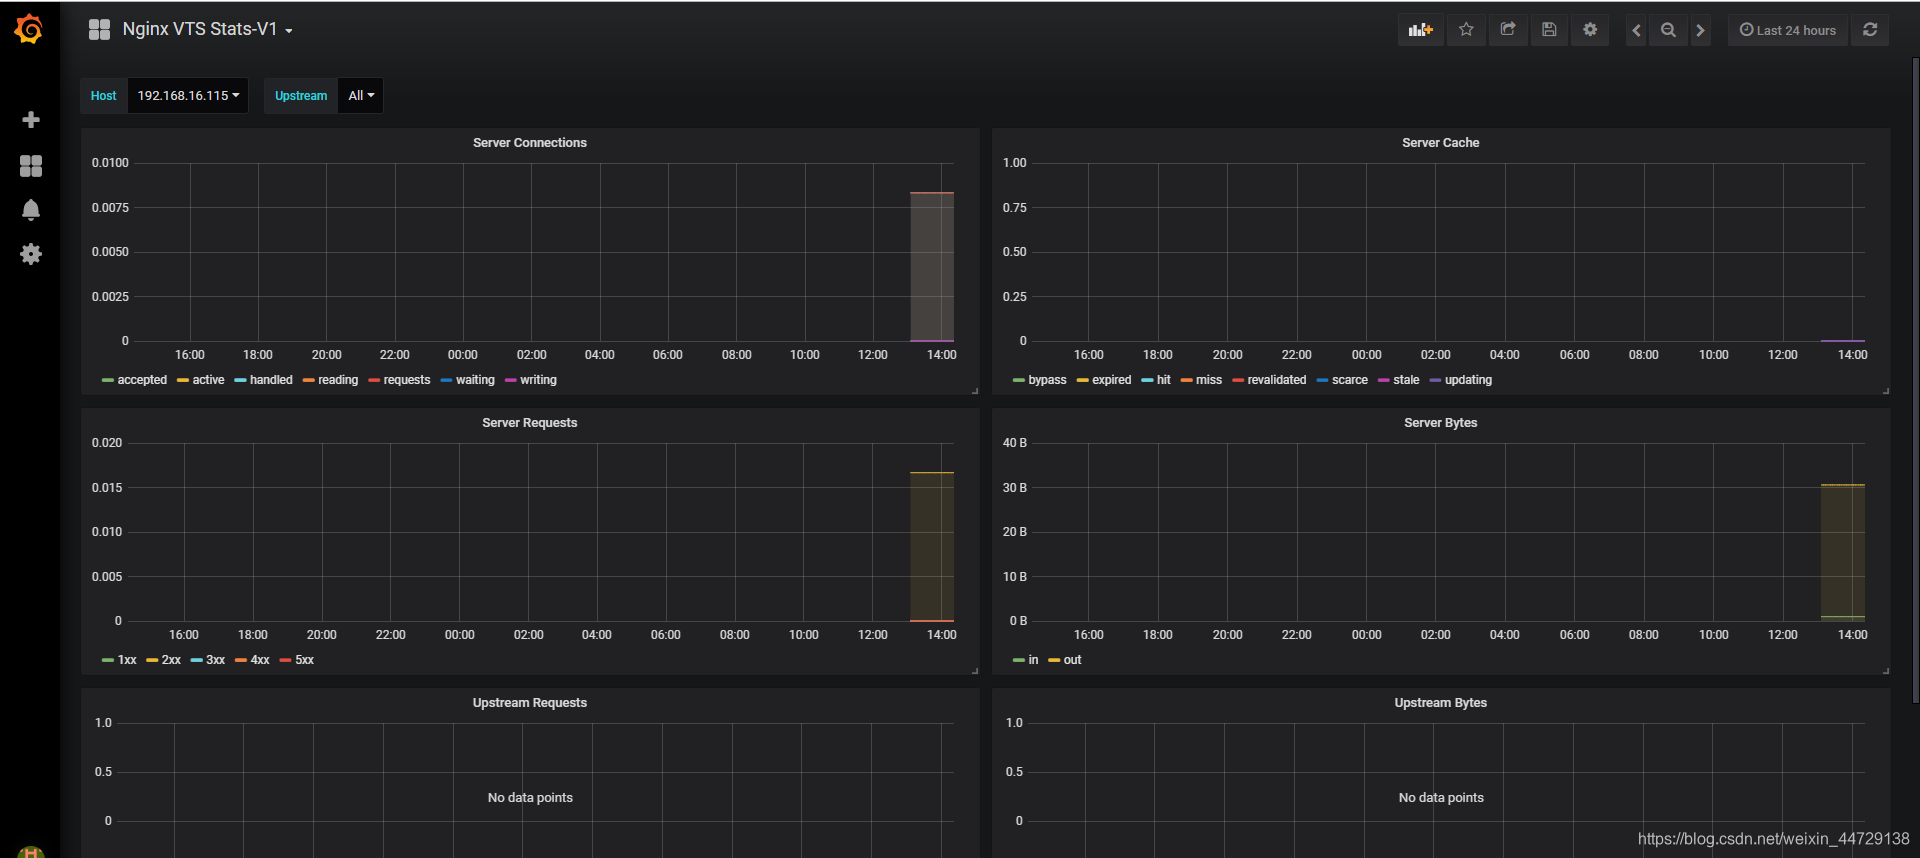
4)Nginx dashbaoard
https://grafana.com/grafana/dashboards/2949
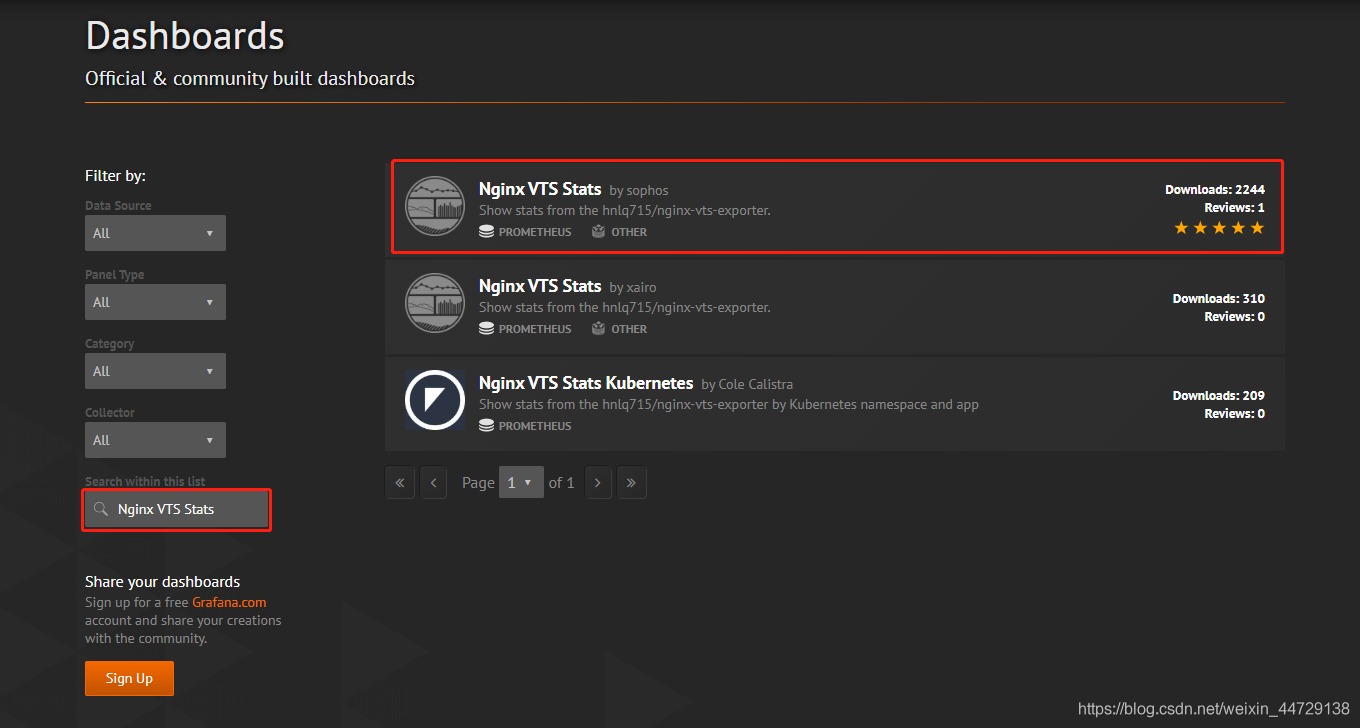

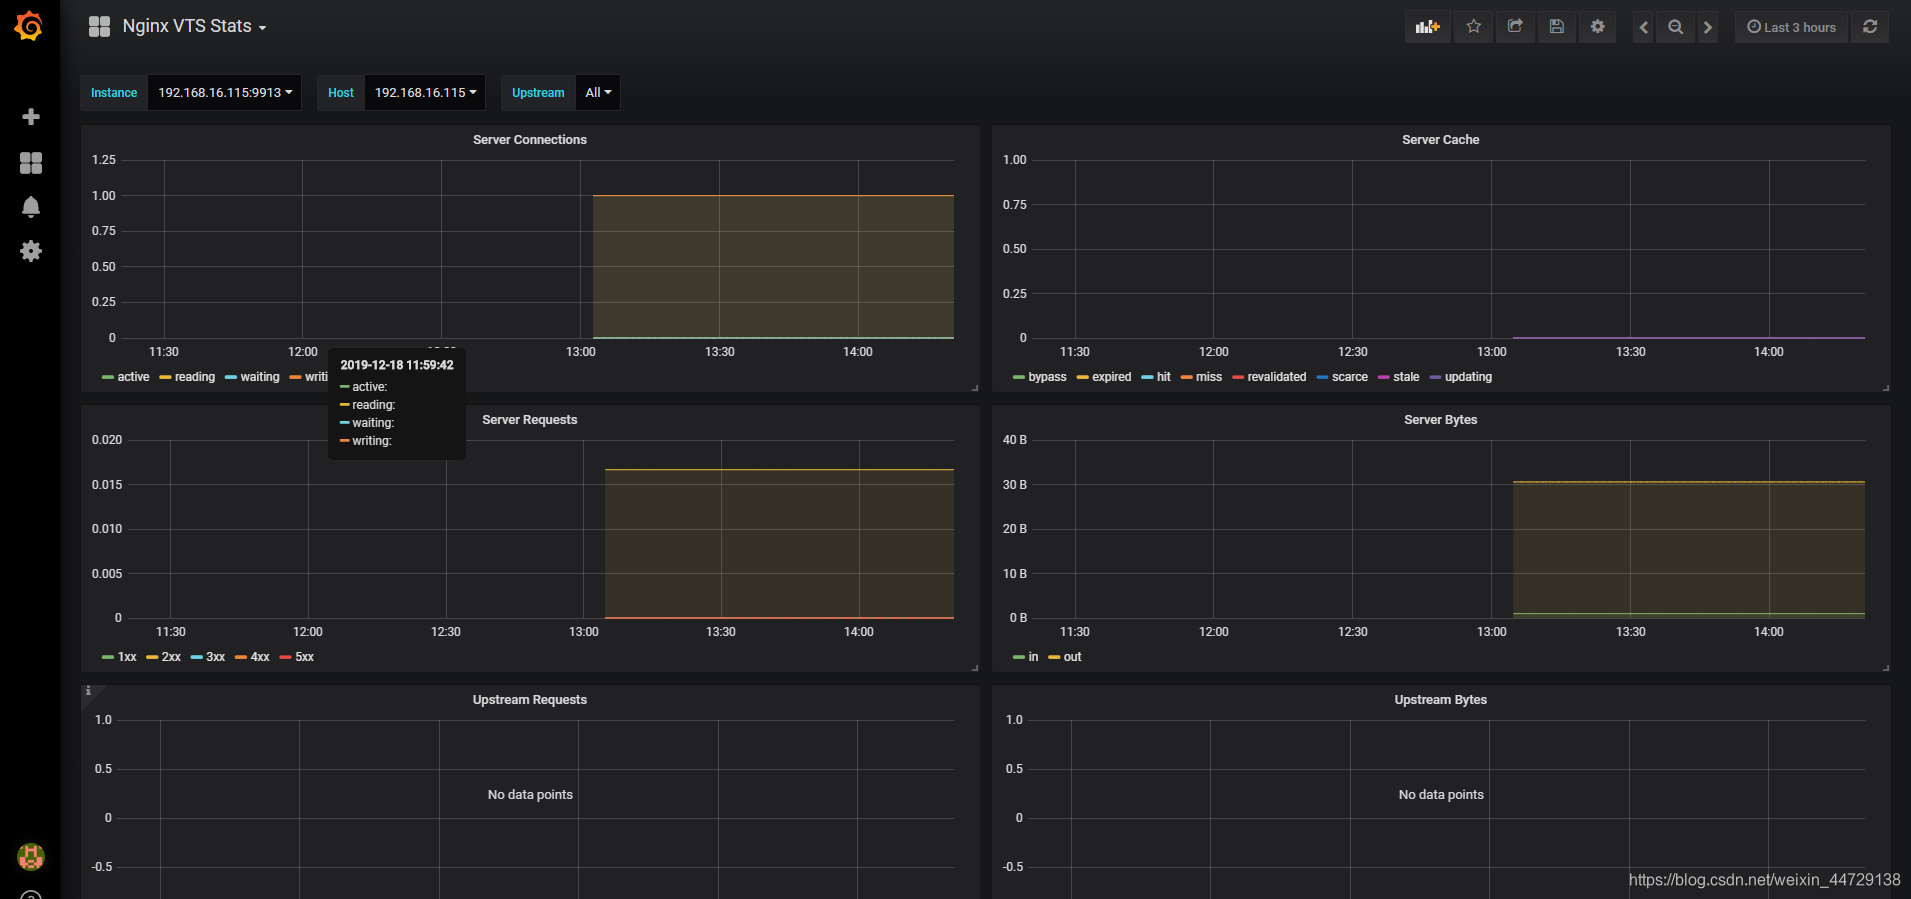
https://grafana.com/grafana/dashboards/2984

扫描二维码关注公众号,回复:
12342330 查看本文章

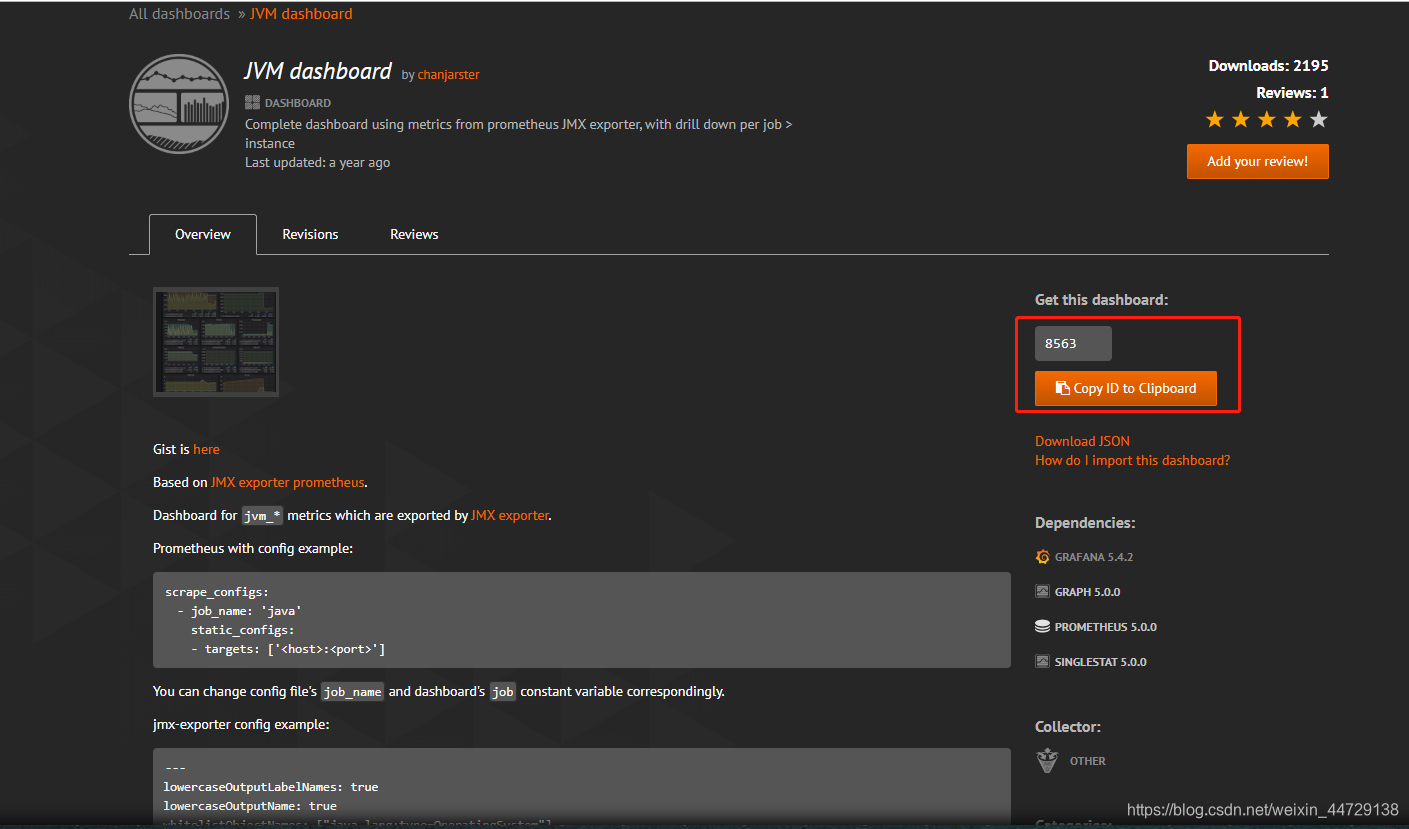
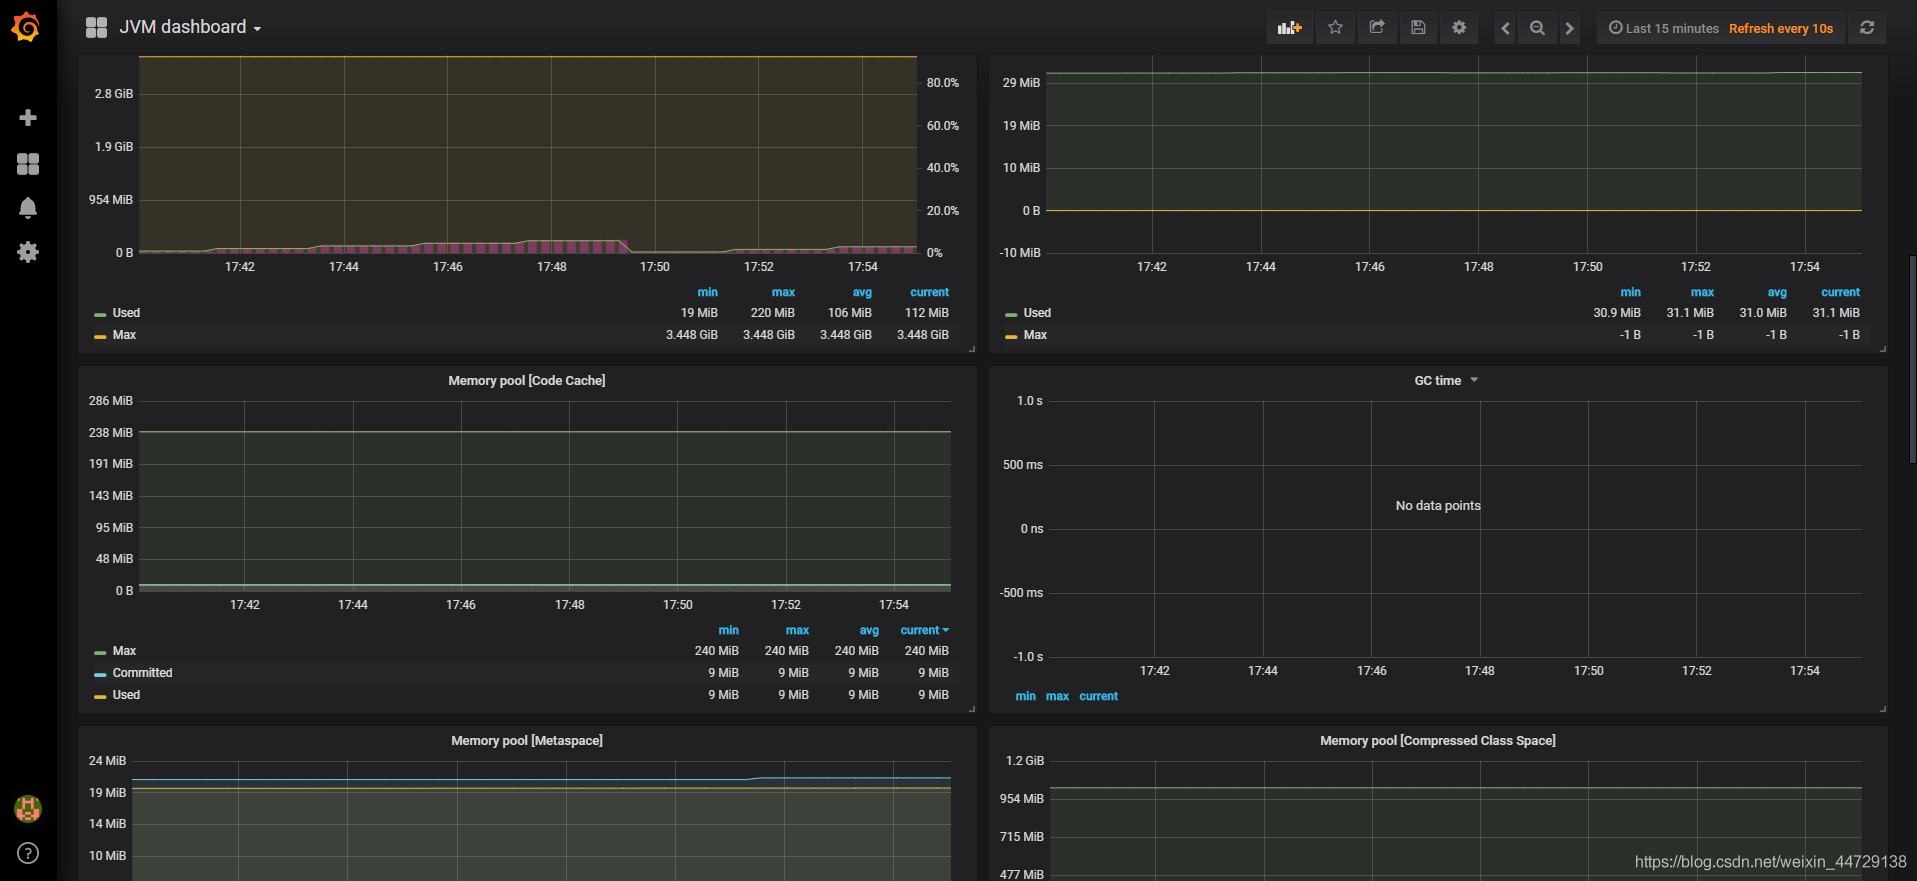
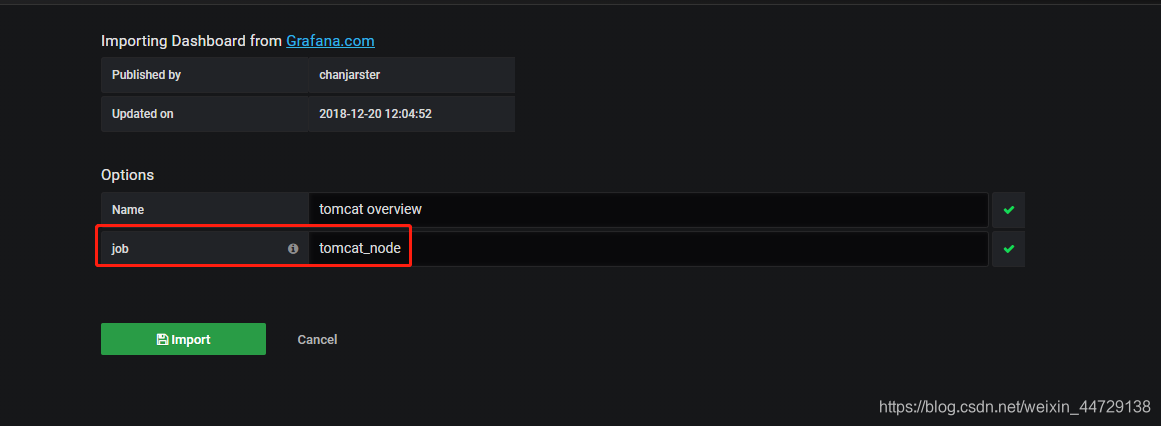
5)tomcat dashboard
https://grafana.com/grafana/dashboards/8563(提供了jmx-exporter的配置)
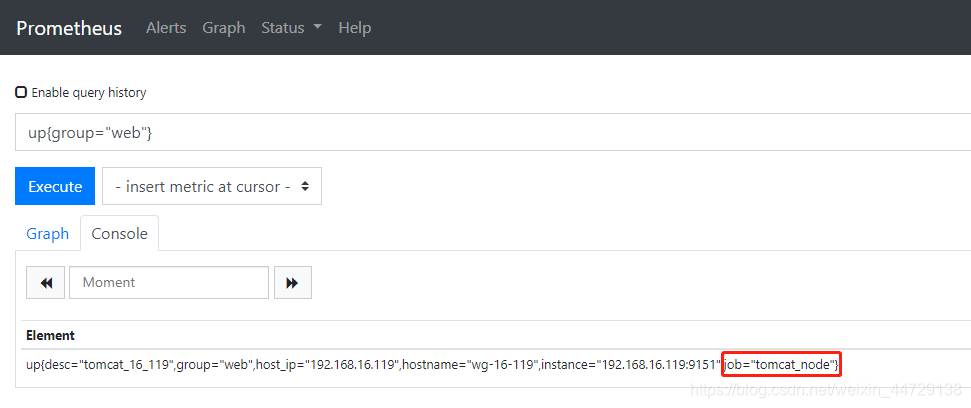
在导入模板时需要输入job的名称,可以根据在promethus的web端查看或配置tomcat的json文件(/home/monitor/prometheus/conf.d/tomcat_node.json)中查找job_name名即可
grafana创建用户
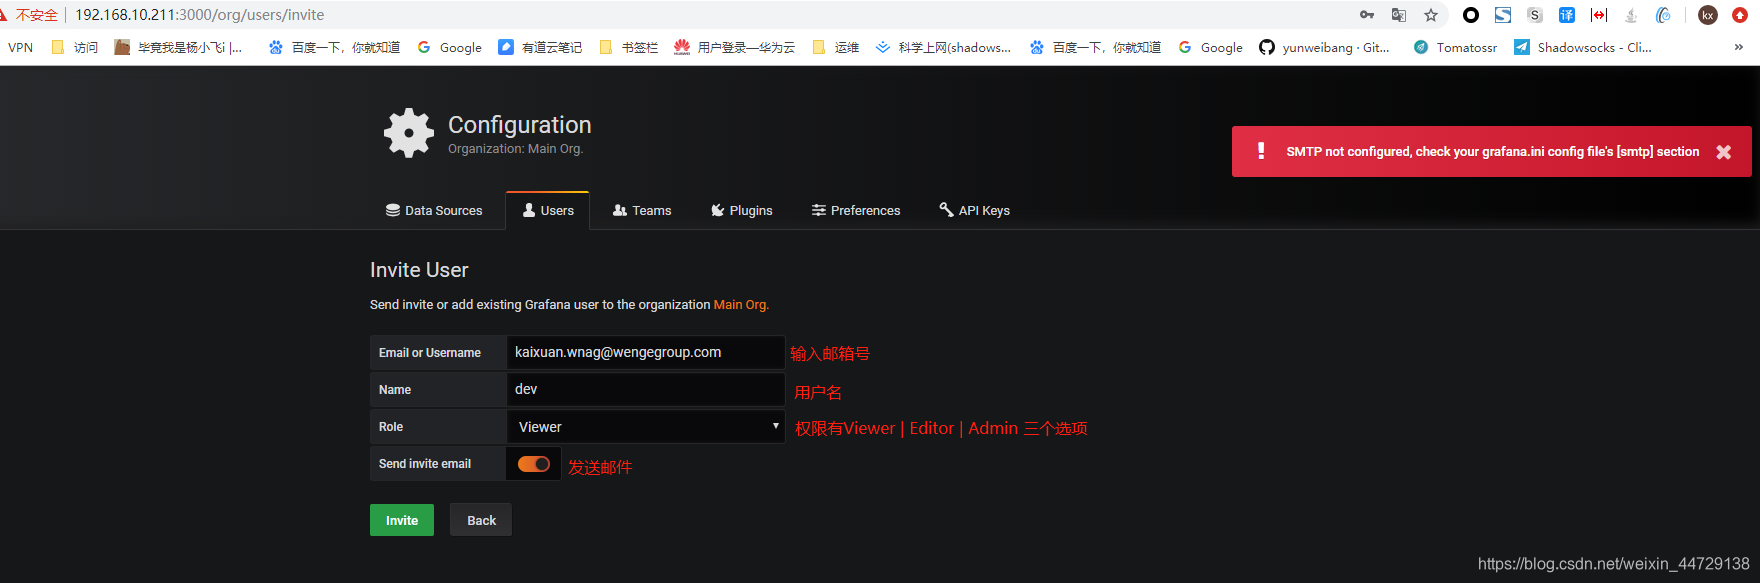
1、通过发送邮件方式创建用户
创建用户,提示未配置邮箱,直接忽略;通过邮箱的方式(这里只是用户名变成了邮箱名而已,实际上并不能将邮件发送到你的邮箱)
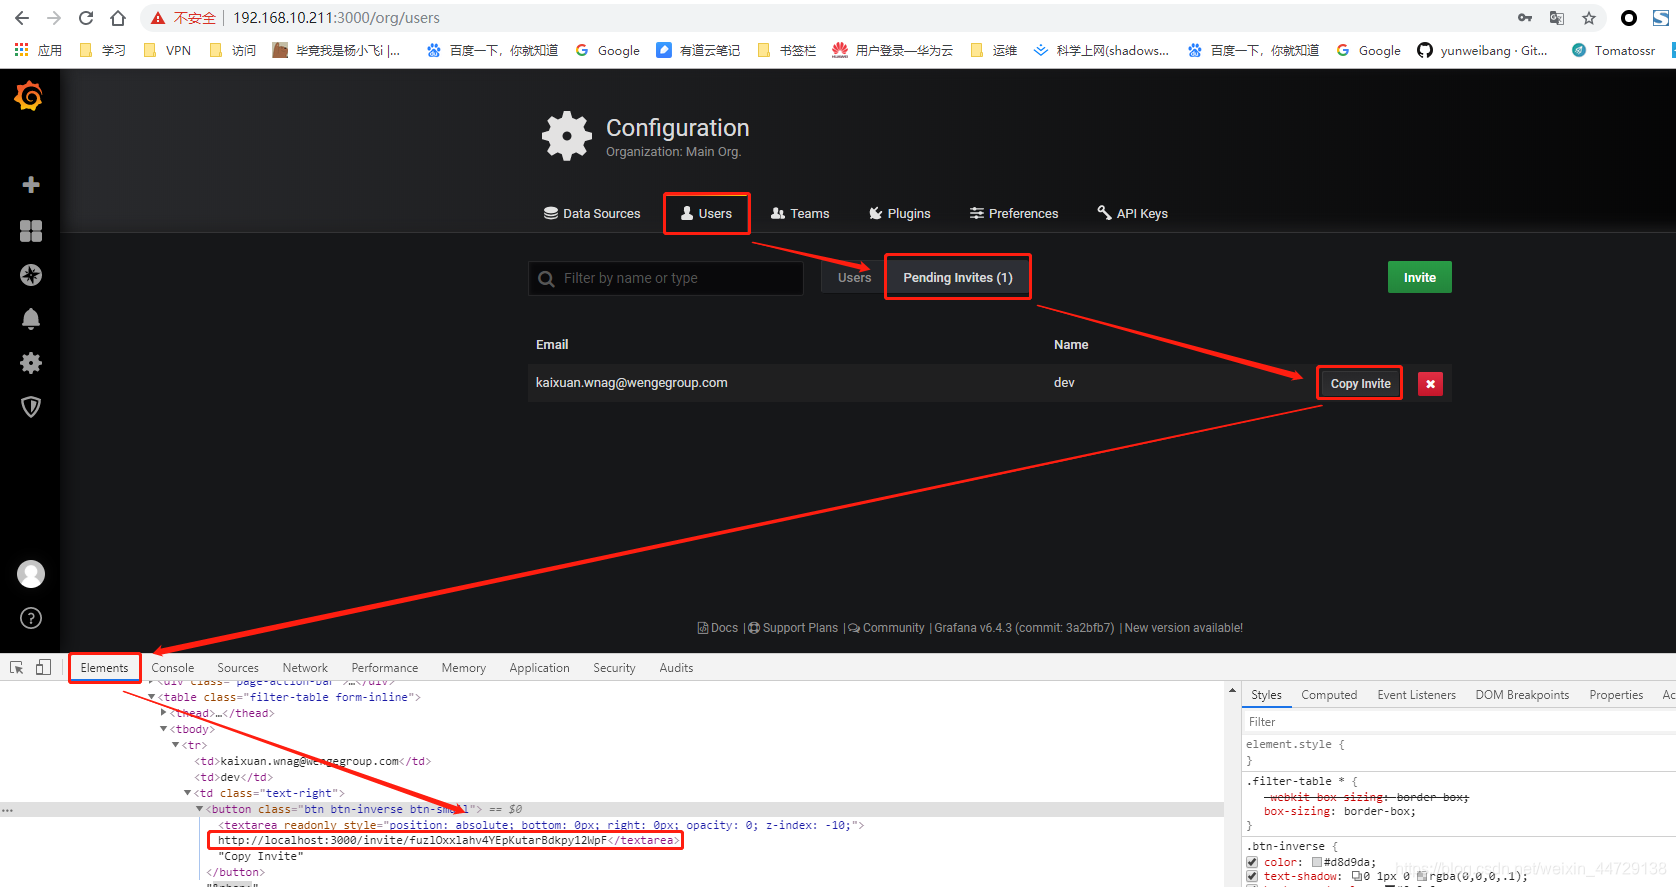
浏览器按F12,查看invite的后端真实链接地址;发现访问的链接地址是localhost;很明显我的本地电脑上没有grafana服务,所以无法打开此地址,也就很难设置密码
2、通过非邮件的方式创建用户
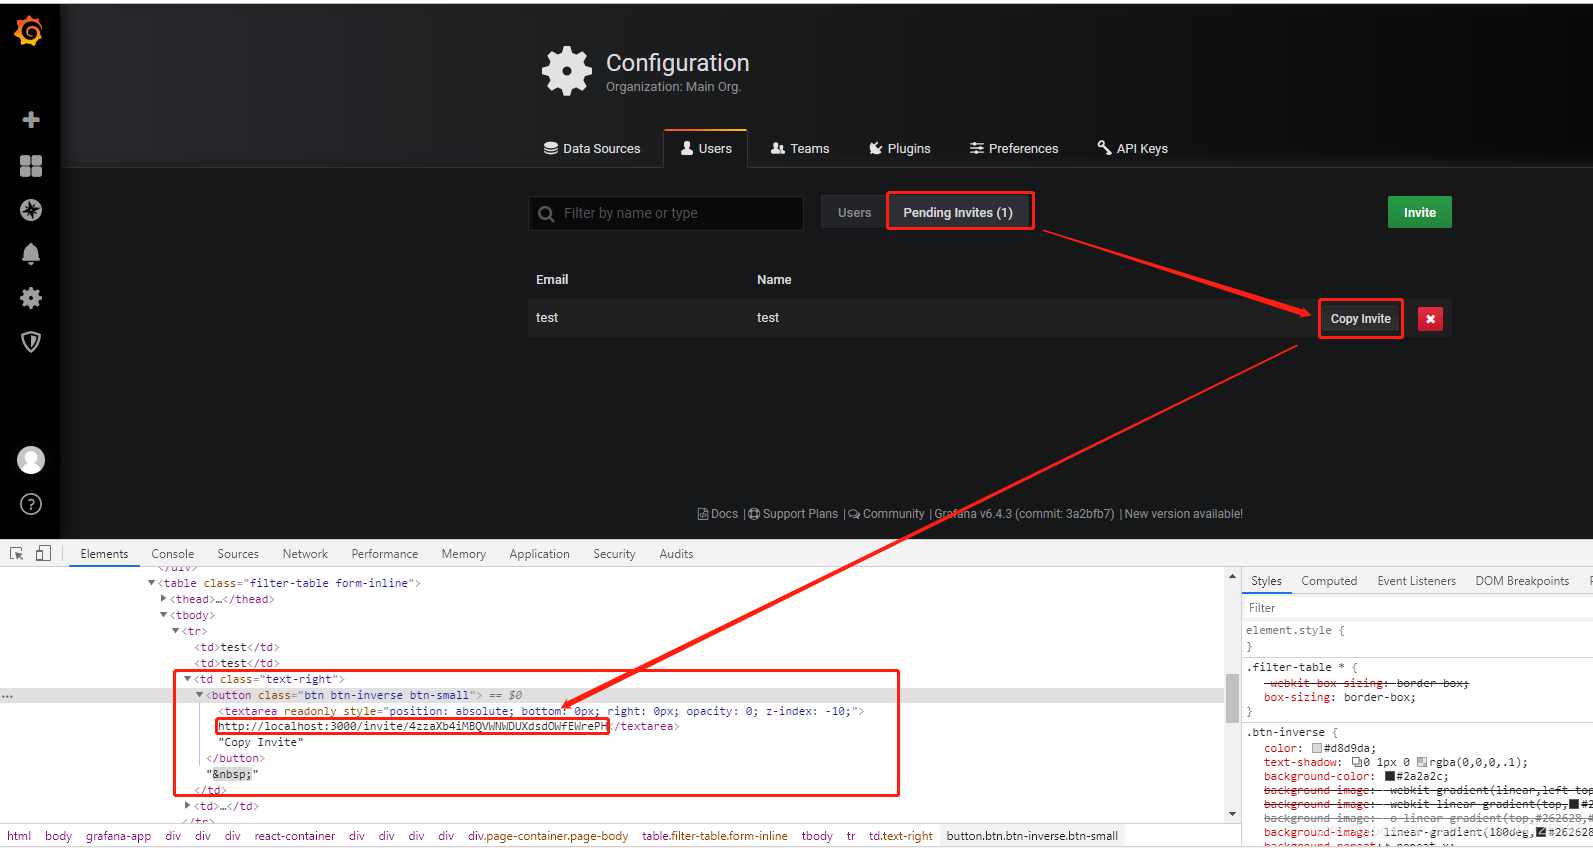

3、解决localhost无法访问invitede地址问题,搭建nginx反向代理
通过以上两种方式会发现,最终的invite邀请连接都无法打开访问,原因是garafana是在服务器上部署着而非我的本地电脑上,怎么解决呢?反向代理,通过nginx跳转访问到我想要访问的目标地址
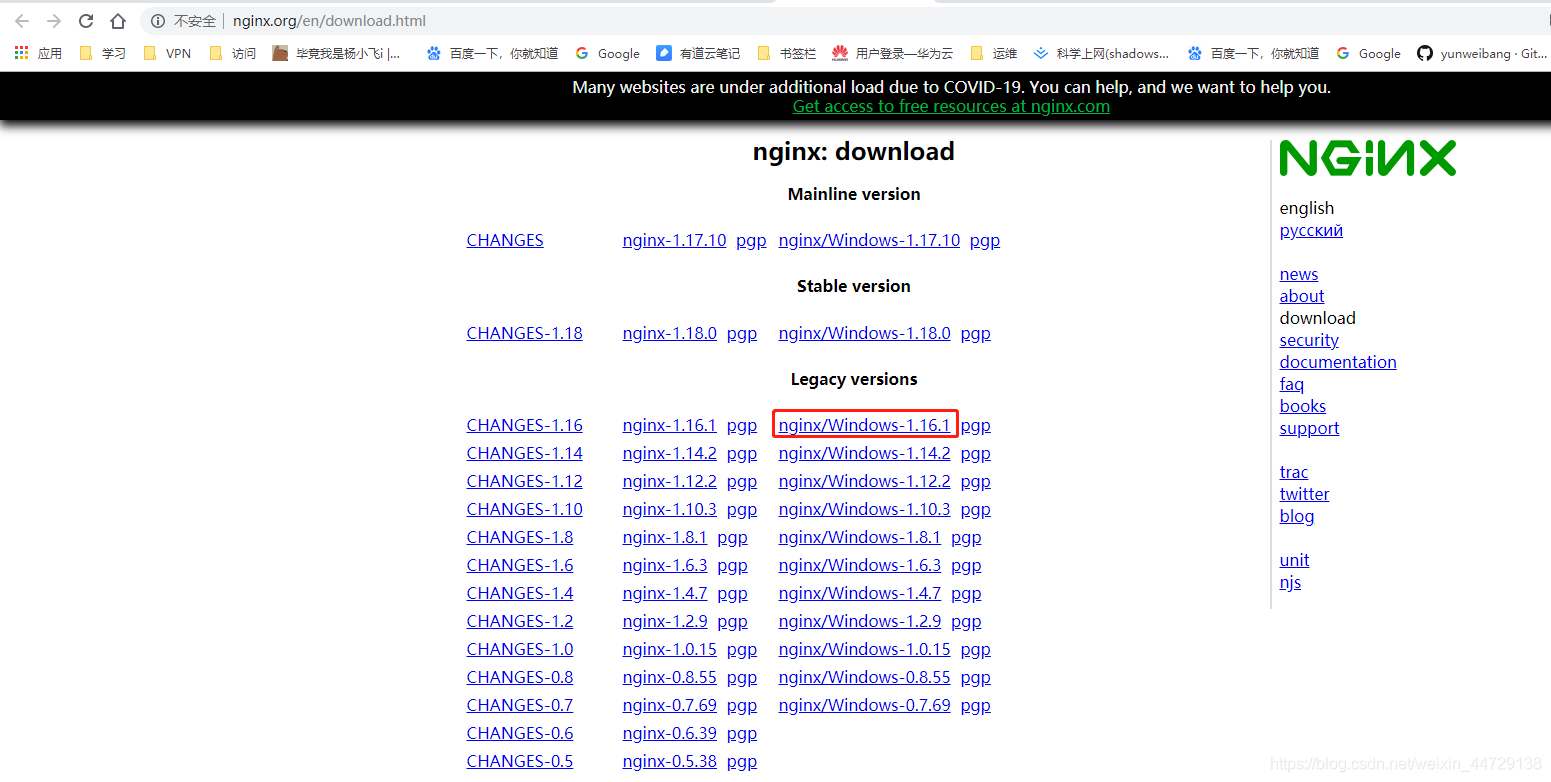
1)下载nginx
http://nginx.org/download/nginx-1.16.1.zip
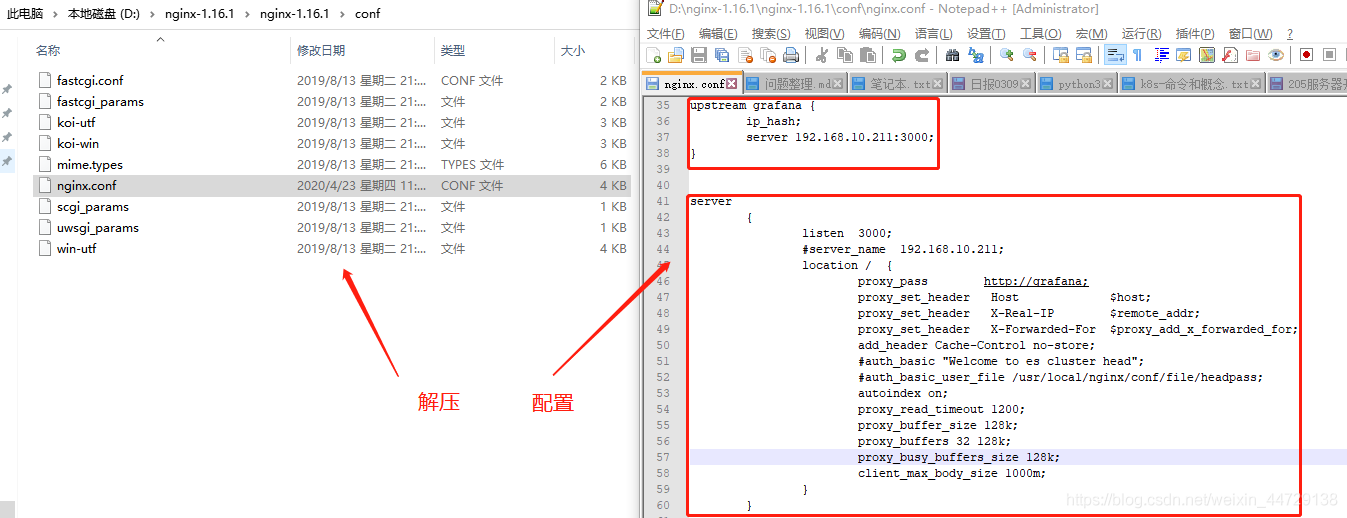
2)解压配置
3)启动nginx
双击nginx.exe即可,并检查监听的端口

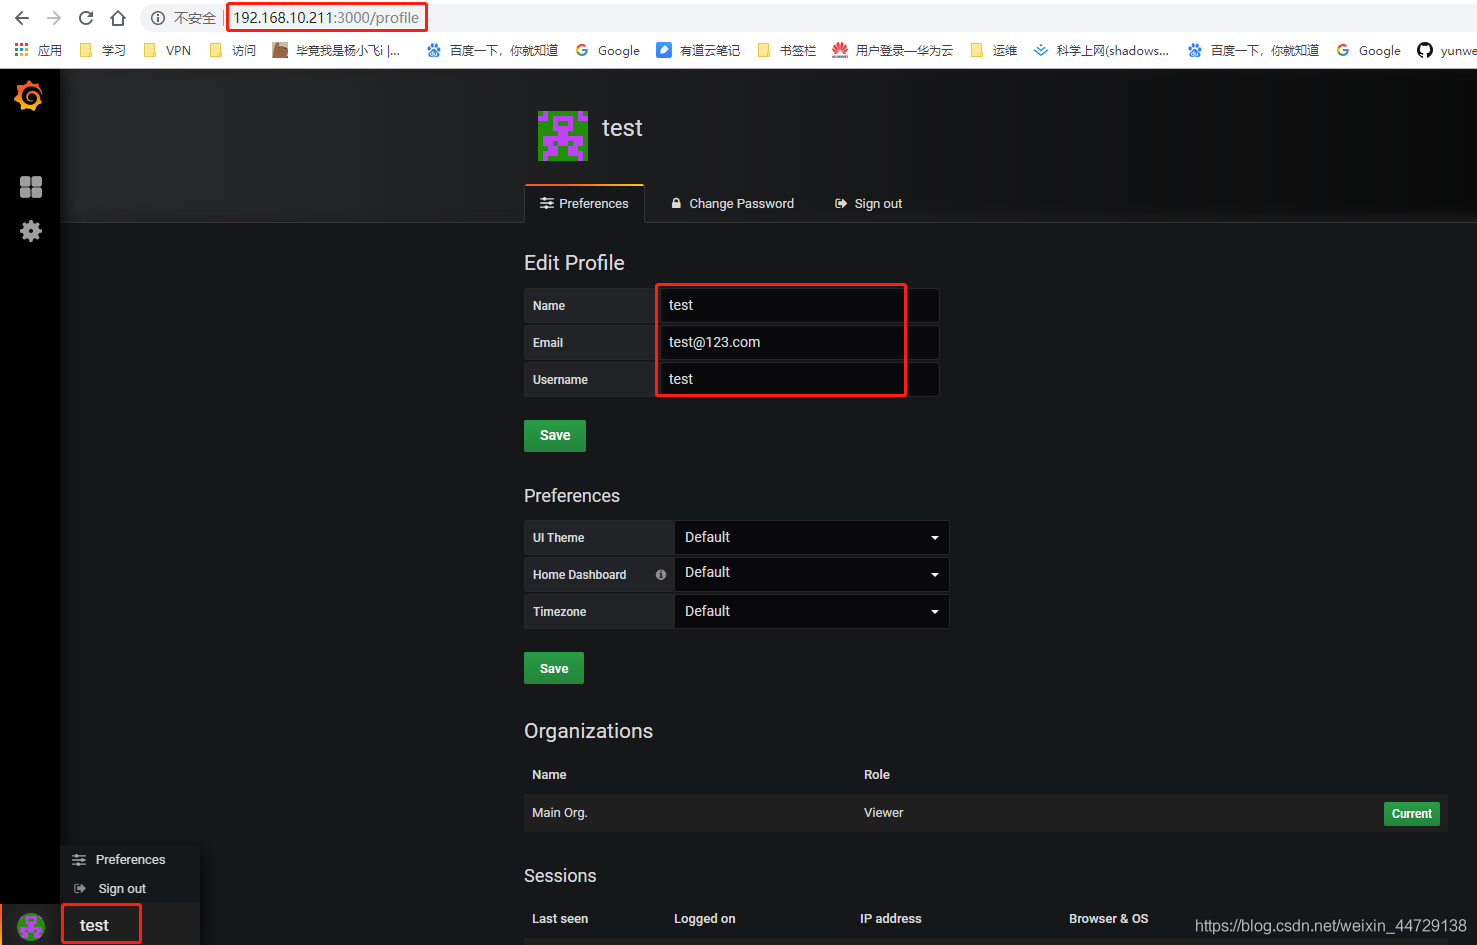
4)登录访问连接(粘贴invite的链接地址)
非邮件方式创建账号,使用用户名即可登录
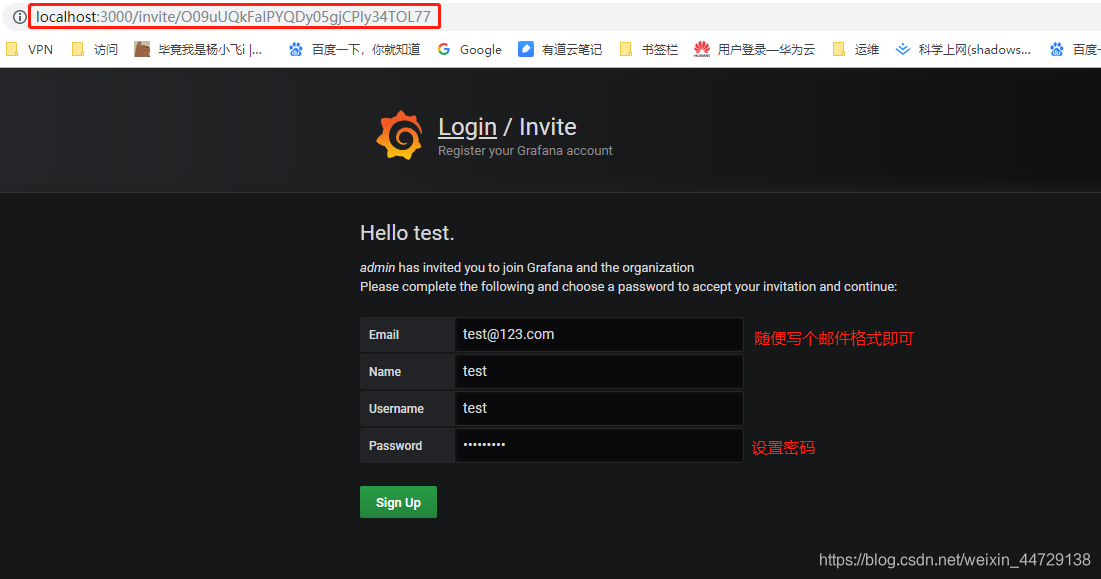
邮件方式创建账号的登录,必须使用邮箱作为用户名才可以登录