<!DOCTYPE>
<html>
<head runat="server">
 <meta charset="UTF-8" />
      <title>geovindu</title>
          <meta name="keywords" content="Geovin Du"/>
    <meta name="description"  content="Geovin Du" />
    <meta name="author" content="Geovin Du" />
    <meta name="copyright" content="涂聚文 Geovin Du" />
    <meta name="robots" content="follow, all" />
              <script type="text/javascript" src="http://code.jquery.com/jquery-1.9.1.js"></script>
    <script src="http://code.highcharts.com/highcharts.js" type="text/javascript"></script>
     <script type="text/javascript" src="js/highcharts-zh_CN.js"></script>
    <!-- 2. Include the Highcharts exporting module script. -->
    <script src="http://code.highcharts.com/modules/exporting.js" type="text/javascript"></script>
     <script type="text/javascript">
         var chart = null;
         var strtile='<%=strtitle %>'
         $(function () {
             chart = Highcharts.chart('container', {
                 chart: {
                     zoomType: 'x'
                 },
                 title: {
                     text: strtile+'新冠状病毒病 , 开始日期:1/22/2020 create dusystem.com'
                 },

                 subtitle: {
                     text: 'Source:by the Center for Systems Science and Engineering (CSSE) at Johns Hopkins University (JHU) 疫情数据 '
                 },

                 yAxis: {
                     title: {
                         text: 'Number of COVID-19'
                     }
                 },

                 xAxis: {
                     type: 'datetime',
                     minRange: 1 * 24 * 3600000, // 1天
                     dateTimeLabelFormats: {
                        day: '%Y-%m-%d',
                        week: '%m-%d',
                        month: '%Y-%m',
                        year: '%Y'
                    },
                    labels: {
                     format: '{value:%Y-%b-%e}'
                      },
                     accessibility: {
                         rangeDescription: 'Range: 2020 to 2020'
                     }
                 },

                 legend: {
                     layout: 'vertical',
                     align: 'right',
                     verticalAlign: 'middle'
                 },

                 plotOptions: {
                     series: {
                         label: {
                             connectorAllowed: false
                         },
                         pointInterval: 24 * 3600 * 1000, //1天
                         pointStart: Date.UTC(2020, 0, 22) //2020/1/22
                     }
                 },

                 series: [
            {
                name: 'Confirmed', //确诊人数
                data: <%=jsonConfirmed %>
            }, {
                name: 'Deaths', //死亡人数
                data:  <%=jsonDeaths %>
            }, {
                name: 'Recovered', //治愈人数
                data:  <%=jsonRecovered %>
            }
            ],


                 responsive: {
                     rules: [{
                         condition: {
                             maxWidth: 500
                         },
                         chartOptions: {
                             legend: {
                                 layout: 'horizontal',
                                 align: 'center',
                                 verticalAlign: 'bottom'
                             }
                         }
                     }]
                 }

             });

         });
</script>
</head>
<body>
    <form id="form1" runat="server">
    <div>
        <asp:GridView ID="GridView1" runat="server">
        </asp:GridView>

            <div id="container" style="max-width:800px;height:400px"></div>

    </div>
    </form>
</body>
</html>
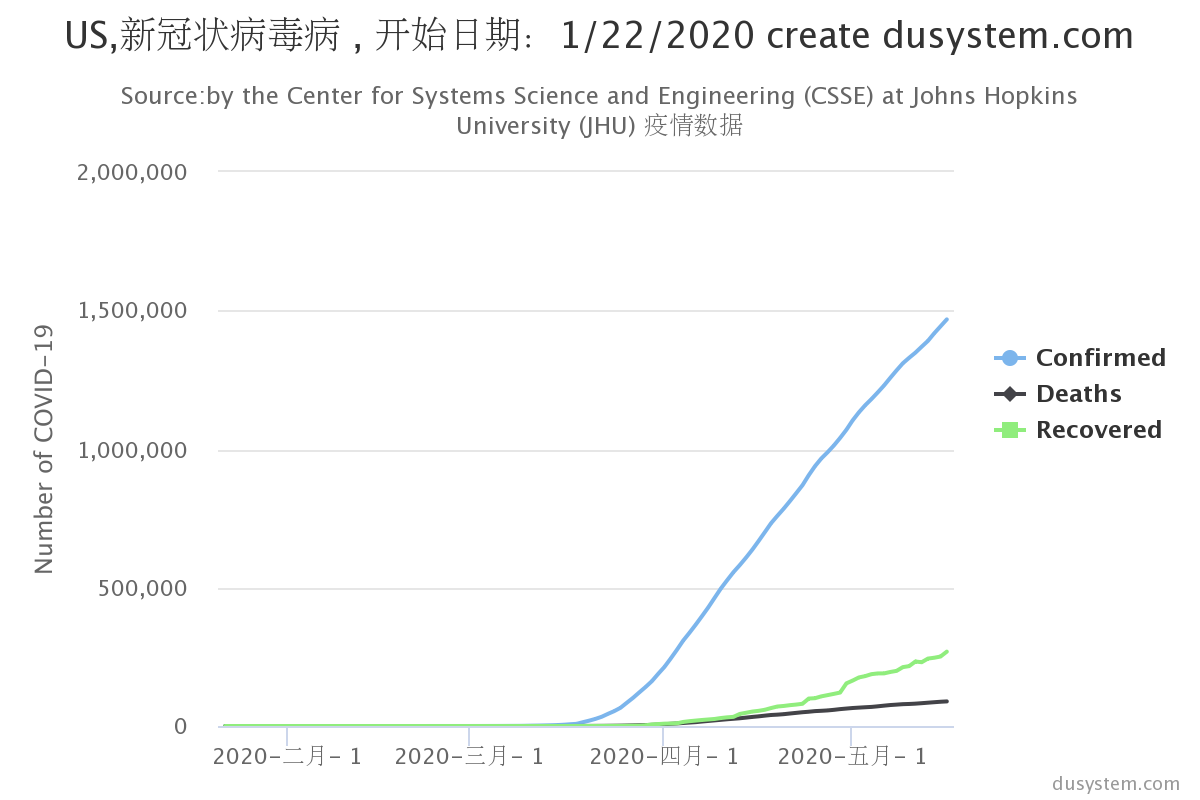
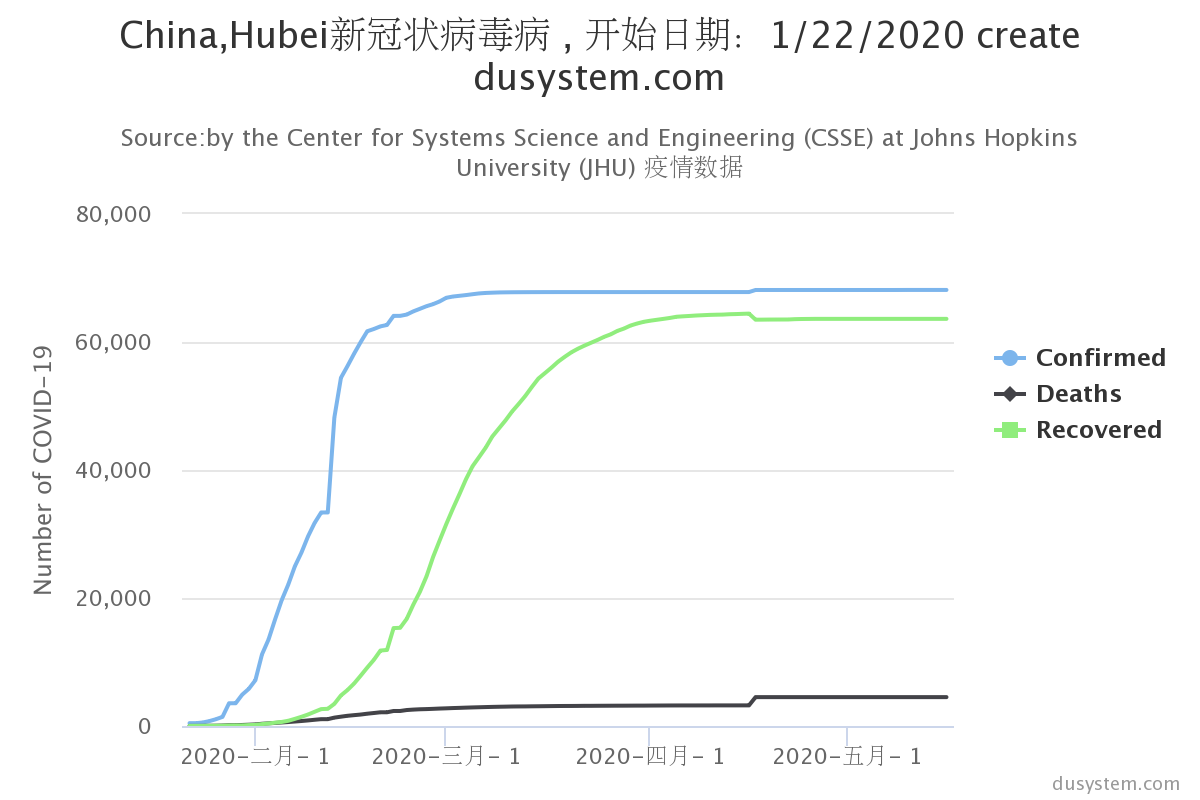
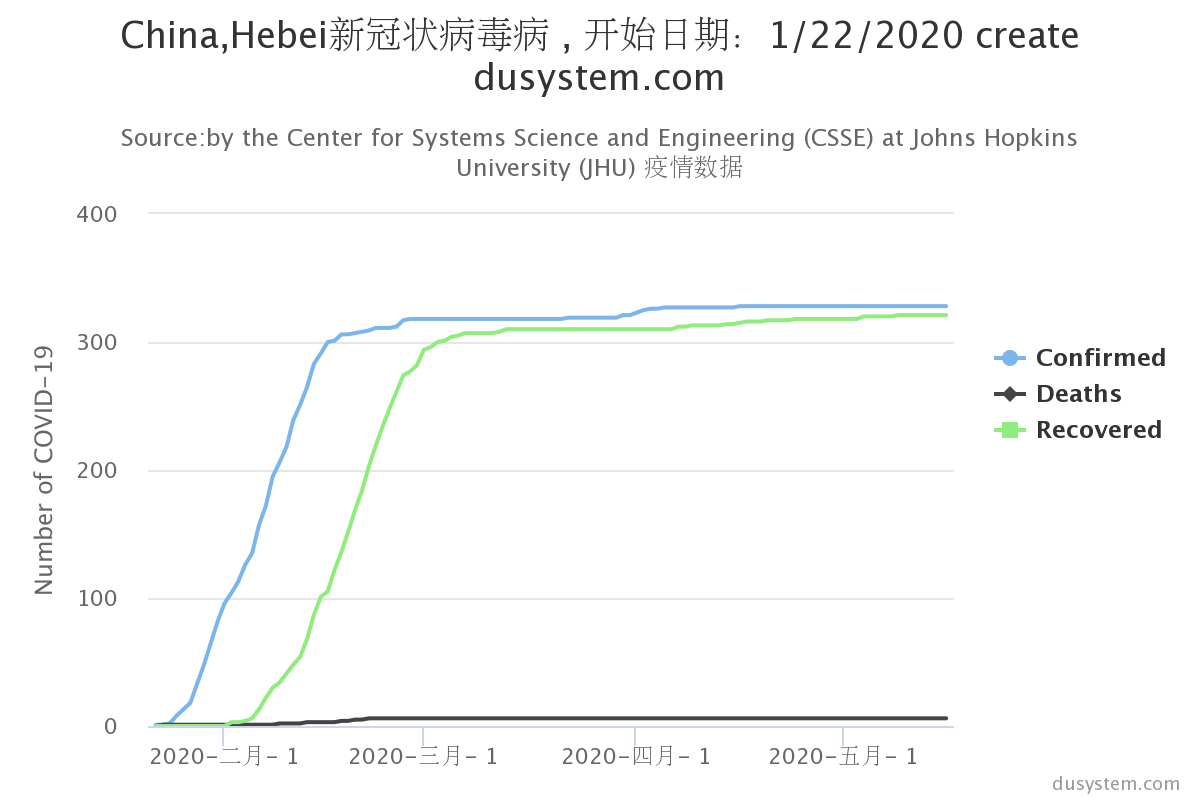
数据来源:https://corona-virus-covid19.com/