这几天再弄一个报表,要统计一些信息最终的部分展示结果如下: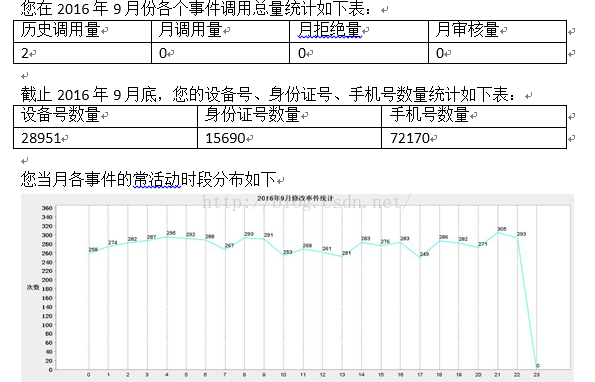
图片得到之后就是生成Word了,基本思路是先用Word做好模板,另存为xml,然后使用freemarker标签来替换,最后改成ftl文件就是模板,图片也只是替换那一大堆编码而已
是否存在,至于具体的循环遍历网上有不再赘述
3.多张图片插入时会遇到图片重复记得改name和src,从List中取出数据并且实现插入多张图片:
4.如果模板太大转成的xml文件太大,看着是密密麻麻的一大片根本无法进一步处理,建议使用IDE进行代码格式化,想eclipse等等一般都可以,如果发现工具也无法格式化可以直接百度xml格式化,然后会有在线的工具
基本工具freemarker,jfreechart
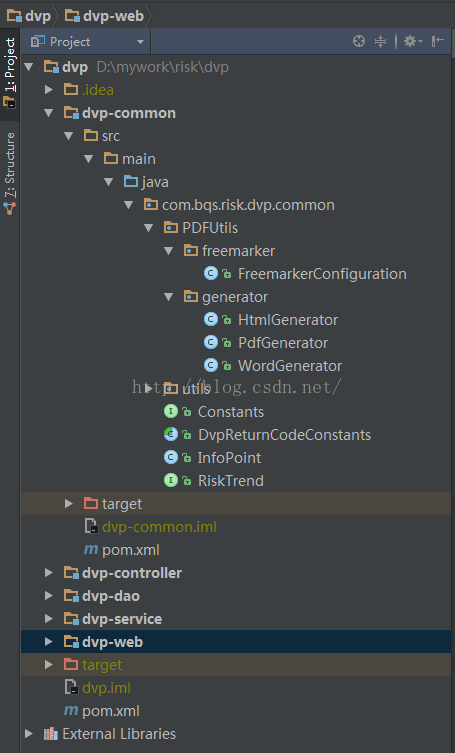
工程的部分结构如下
与生成Word有关的类主要有FreemarkerConfiguration和WordGenerator代码如下:
- import com.bqs.ares.common.utils.CommonUtils;
- import freemarker.template.Configuration;
- import java.io.File;
- import org.slf4j.Logger;
- import org.slf4j.LoggerFactory;
- /**
- * Created by lenovo on 2016/9/27.
- */
- public class FreemarkerConfiguration {
- private static Logger log = LoggerFactory.getLogger(FreemarkerConfiguration.class);
- private final static String filepath = "/freemarkerTemplate";
- private static Configuration configuration=null;
- public static Configuration getConfiguration(){
- if(configuration==null){
- configuration=new Configuration();
- try {
- configuration.setDirectoryForTemplateLoading(new File(CommonUtils.class.getResource(filepath).getFile()));
- }catch (Exception e){
- log.error(e.getMessage());
- }
- }
- return configuration;
- }
- }
- import com.bqs.risk.dvp.common.PDFUtils.freemarker.FreemarkerConfiguration;
- import freemarker.template.Configuration;
- import freemarker.template.Template;
- import java.io.*;
- import java.util.Map;
- /**
- * Created by lenovo on 2016/10/9.
- */
- public class WordGenerator {
- /**
- * Generate html string.
- *
- * @param template the name of freemarker teamlate.
- * @param variables the data of teamlate.
- * @return htmlStr
- * @throws Exception
- */
- public static void generate(String template, Map<String,Object> variables, String htmlName) throws Exception{
- String basePath=HtmlGenerator.class.getResource("/").getPath()+"/freemarkerTemplate/word/";
- Configuration config = FreemarkerConfiguration.getConfiguration();
- config.setDefaultEncoding("UTF-8");
- Template tp = config.getTemplate(template);
- tp.setEncoding("UTF-8");
- String htmlPath=basePath+htmlName+".doc";
- File file = new File(htmlPath);
- if (!file.exists())
- file.createNewFile();
- Writer out = new BufferedWriter(new OutputStreamWriter(
- new FileOutputStream(file), "utf-8"));
- tp.process(variables, out);
- out.flush();
- out.close();
- }
- }
用jfreeChart生成折线图和饼图的代码如下:
- import com.bqs.risk.dvp.common.InfoPoint;
- import org.jfree.chart.ChartFactory;
- import org.jfree.chart.ChartUtilities;
- import org.jfree.chart.JFreeChart;
- import org.jfree.chart.axis.NumberAxis;
- import org.jfree.chart.labels.ItemLabelAnchor;
- import org.jfree.chart.labels.ItemLabelPosition;
- import org.jfree.chart.labels.StandardCategoryItemLabelGenerator;
- import org.jfree.chart.labels.StandardPieSectionLabelGenerator;
- import org.jfree.chart.plot.CategoryPlot;
- import org.jfree.chart.plot.PiePlot;
- import org.jfree.chart.plot.PlotOrientation;
- import org.jfree.chart.renderer.category.LineAndShapeRenderer;
- import org.jfree.chart.title.TextTitle;
- import org.jfree.data.category.DefaultCategoryDataset;
- import org.jfree.data.general.DefaultPieDataset;
- import org.jfree.ui.TextAnchor;
- import java.awt.*;
- import java.io.File;
- import java.io.IOException;
- import java.text.NumberFormat;
- import java.util.*;
- import java.util.List;
- /**
- * Created by lenovo on 2016/9/28.
- */
- public class JfreeChartUtils {
- private static Map<String,String> relationNameMap=null;
- private static DefaultCategoryDataset createDataset(int[] data) {
- DefaultCategoryDataset linedataset = new DefaultCategoryDataset();
- // 曲线名称
- String series = "时间-次数"; // series指的就是报表里的那条数据线
- //因此 对数据线的相关设置就需要联系到serise
- //比如说setSeriesPaint 设置数据线的颜色
- // 横轴名称(列名称)
- String[] time = new String[24];
- for (int i = 0; i < 24; i++) {
- time[i] = i + "";
- }
- //添加数据值
- for (int i = 0; i < data.length; i++) {
- linedataset.addValue(data[i], //值
- series, //哪条数据线
- time[i]); // 对应的横轴
- }
- return linedataset;
- }
- //生成事件统计图
- public static String createChart(String eventTypevalue, int[] data, String imageName) {
- String returnImagePath = "";
- Calendar calendar = Calendar.getInstance();
- calendar.setTime(new Date());
- calendar.add(Calendar.MONTH, -1);
- if (data == null || data.length <= 0) {
- return null;
- }
- if (imageName == null || imageName.equals("")) {
- return null;
- }
- try {
- //定义图标对象
- JFreeChart chart = ChartFactory.createLineChart(null,// 报表题目,字符串类型
- "时间", // 横轴
- "次数", // 纵轴
- createDataset(data), // 获得数据集
- PlotOrientation.VERTICAL, // 图标方向垂直
- false, // 显示图例
- false, // 不用生成工具
- false // 不用生成URL地址
- );
- chart.setTitle(calendar.get(Calendar.YEAR) + "年" + (calendar.get(Calendar.MONTH) + 1) + "月" + eventTypevalue + "统计 ");
- chart.setTitle(new TextTitle(chart.getTitle().getText(),new Font("宋体", 1, 13)));
- //整个大的框架属于chart 可以设置chart的背景颜色
- // 生成图形
- CategoryPlot plot = chart.getCategoryPlot();
- // 图像属性部分
- plot.setBackgroundPaint(Color.WHITE);
- plot.setDomainGridlinesVisible(true); //设置背景网格线是否可见
- plot.setDomainGridlinePaint(Color.BLACK); //设置背景网格线颜色
- plot.setRangeGridlinePaint(Color.WHITE);
- plot.setNoDataMessage("没有数据");//没有数据时显示的文字说明。
- // 数据轴属性部分
- NumberAxis rangeAxis = (NumberAxis) plot.getRangeAxis();
- rangeAxis.setLabelFont(new Font("宋体", 1, 12));
- rangeAxis.setTickLabelFont((new Font("宋体", 1, 12)));
- rangeAxis.setStandardTickUnits(NumberAxis.createIntegerTickUnits());
- rangeAxis.setAutoRangeIncludesZero(true); //自动生成
- rangeAxis.setUpperMargin(0.20);
- rangeAxis.setLabelAngle(Math.PI / 2.0);
- rangeAxis.setAutoRange(false);
- // 数据渲染部分 主要是对折线做操作
- LineAndShapeRenderer renderer = (LineAndShapeRenderer) plot.getRenderer();
- renderer.setBaseItemLabelsVisible(true);
- renderer.setSeriesPaint(0, Color.CYAN); //设置折线的颜色
- renderer.setBaseShapesFilled(true);
- renderer.setBaseItemLabelsVisible(true);
- renderer.setBasePositiveItemLabelPosition(new ItemLabelPosition(ItemLabelAnchor.OUTSIDE12, TextAnchor.BASELINE_LEFT));
- renderer.setBaseItemLabelGenerator(new StandardCategoryItemLabelGenerator());
- renderer.setBaseItemLabelFont(new Font("Dialog", 1, 10)); //设置提示折点数据形状
- plot.setRenderer(renderer);
- // 创建文件输出流
- String imagePath = JfreeChartUtils.class.getResource("/").getPath() + "/freemarkerTemplate/images/" + imageName + ".jpg";
- File fos_jpg = new File(imagePath);
- if (!fos_jpg.exists()) {
- fos_jpg.createNewFile();
- }
- // 输出到哪个输出流
- ChartUtilities.saveChartAsJPEG(fos_jpg, chart, // 统计图表对象
- 1100, // 宽
- 400 // 高
- );
- returnImagePath = imagePath;
- } catch (IOException e) {
- e.printStackTrace();
- }
- return returnImagePath;
- }
- /**
- * 用户设备关联图,每一张图有三条线
- *
- * @param titleName:
- * @param relatioContentList
- * @return 图片的地址
- */
- public static String createChart(String imageName, String titleName, Map<String, Map<String, String>> relatioContentList) {
- String imageFilePath = "";
- Calendar calendar = Calendar.getInstance();
- calendar.setTime(new Date());
- calendar.add(Calendar.MONTH, -1);
- //定义图标对象
- try {
- JFreeChart chart = ChartFactory.createLineChart(null,// 报表题目,字符串类型
- "数量", // 横轴
- "计数", // 纵轴
- createDataset(relatioContentList), // 获得数据集
- PlotOrientation.VERTICAL, // 图标方向垂直
- true, // 显示图例
- false, // 不用生成工具
- false // 不用生成URL地址
- );
- chart.setTitle(calendar.get(Calendar.YEAR) + "年" + (calendar.get(Calendar.MONTH) + 1) + "月" + titleName + "统计 ");
- chart.setTitle(new TextTitle(chart.getTitle().getText(),new Font("宋体", 1, 13)));
- //整个大的框架属于chart 可以设置chart的背景颜色
- // 生成图形
- CategoryPlot plot = chart.getCategoryPlot();
- // 图像属性部分
- plot.setBackgroundPaint(Color.WHITE);
- plot.setDomainGridlinesVisible(true); //设置背景网格线是否可见
- plot.setDomainGridlinePaint(Color.BLACK); //设置背景网格线颜色
- plot.setRangeGridlinePaint(Color.WHITE);
- plot.setNoDataMessage("没有数据");//没有数据时显示的文字说明。
- // 数据轴属性部分
- NumberAxis rangeAxis = (NumberAxis) plot.getRangeAxis();
- rangeAxis.setLabelFont((new Font("宋体", 1, 12)));
- rangeAxis.setTickLabelFont((new Font("宋体", 1, 12)));
- rangeAxis.setStandardTickUnits(NumberAxis.createIntegerTickUnits());
- rangeAxis.setAutoRangeIncludesZero(true); //自动生成
- rangeAxis.setUpperMargin(0.20);
- rangeAxis.setLabelAngle(Math.PI / 2.0);
- rangeAxis.setAutoRange(false);
- // 数据渲染部分 主要是对折线做操作
- LineAndShapeRenderer renderer = (LineAndShapeRenderer) plot.getRenderer();
- renderer.setBaseItemLabelsVisible(true);
- renderer.setSeriesPaint(0, Color.CYAN); //设置折线的颜色
- renderer.setBaseShapesFilled(true);
- renderer.setBaseItemLabelsVisible(true);
- renderer.setBasePositiveItemLabelPosition(new ItemLabelPosition(ItemLabelAnchor.OUTSIDE12, TextAnchor.BASELINE_LEFT));
- renderer.setBaseItemLabelGenerator(new StandardCategoryItemLabelGenerator());
- renderer.setBaseItemLabelFont(new Font("Dialog", 1, 10)); //设置提示折点数据形状
- plot.setRenderer(renderer);
- // 创建文件输出流
- imageFilePath = JfreeChartUtils.class.getResource("/").getPath() + "/freemarkerTemplate/images/" + imageName + ".jpg";
- File fos_jpg = new File(imageFilePath);
- if (!fos_jpg.exists()) {
- fos_jpg.createNewFile();
- }
- // 输出到哪个输出流
- ChartUtilities.saveChartAsJPEG(fos_jpg, chart, // 统计图表对象
- 1100, // 宽
- 400 // 高
- );
- } catch (IOException e) {
- e.printStackTrace();
- }
- return imageFilePath;
- }
- private static DefaultCategoryDataset createDataset(Map<String, Map<String, String>> relatioContentList) {
- if(relationNameMap==null){
- relationNameMap=new HashMap<>();
- //此处省略
- }
- DefaultCategoryDataset linedataset = new DefaultCategoryDataset();
- for (Map.Entry<String, Map<String, String>> relation : relatioContentList.entrySet()) {
- //得到hbase中一列数据就是一条线
- String relationName =relationNameMap.get(relation.getKey());
- Map<String, String> relationContent = relation.getValue();
- List<Point> points = new ArrayList<>();//点
- for (Map.Entry<String, String> numCounts : relationContent.entrySet()) {
- int x = Integer.parseInt(numCounts.getKey());
- int y = Integer.parseInt(numCounts.getValue());
- Point p = new Point(x, y);
- points.add(p);
- }
- points.sort((p1, p2) -> p1.getX() - p2.getX());
- //添加数据值
- if (points != null && points.size() > 0) {
- for (Point p : points) {
- linedataset.addValue(p.getY(), //值
- relationName,//哪条数据线
- p.getX() + ""); // 对应的横轴
- }
- }
- }
- return linedataset;
- }
- public static List<InfoPoint> getTop20Points(Map<String, String> values) {
- if (values == null || values.size() < 0) {
- return null;
- }
- List<InfoPoint> pointList = new ArrayList<>();
- for (Map.Entry<String, String> value : values.entrySet()) {
- String info = value.getKey();
- int num = Integer.parseInt(value.getValue());
- InfoPoint infoPoint = new InfoPoint(info, num);
- pointList.add(infoPoint);
- }
- pointList.sort((p1, p2) -> p2.getNum() - p1.getNum());
- if (pointList.size() > 20) {
- for (int i = 20; i < pointList.size(); i++) {
- pointList.remove(i);
- }
- }
- return pointList;
- }
- //生成城市分布的饼图
- public static String creatLocationPieChart(String imageName, String typeInfo, Map<String, String> locationInfo) {
- if (locationInfo == null || locationInfo.size() <= 0) {
- return null;
- }
- String imageFilePath="";
- try {
- //设置饼图数据集
- DefaultPieDataset dataset = new DefaultPieDataset();
- List<InfoPoint> infoPoints=new ArrayList<>();
- for (Map.Entry<String, String> info : locationInfo.entrySet()) {
- String city = info.getKey();
- int num = Integer.parseInt(info.getValue());
- InfoPoint point=new InfoPoint();
- point.setInfo(city);
- point.setNum(num);
- infoPoints.add(point);
- }
- if(infoPoints!=null&&infoPoints.size()>8){
- infoPoints=infoPoints.subList(0,8);
- }
- for(InfoPoint infoPoint:infoPoints){
- dataset.setValue(infoPoint.getInfo(),infoPoint.getNum());
- }
- //通过工厂类生成JFreeChart对象
- JFreeChart chart = ChartFactory.createPieChart(typeInfo + "分布图", dataset, true, true, false);
- chart.setTitle(new TextTitle(chart.getTitle().getText(),new Font("宋体", 1, 13)));
- //加个副标题
- PiePlot pieplot = (PiePlot) chart.getPlot();
- pieplot.setLabelFont(new Font("宋体", 0, 11));
- //设置饼图是圆的(true),还是椭圆的(false);默认为true
- pieplot.setCircular(true);
- StandardPieSectionLabelGenerator standarPieIG = new StandardPieSectionLabelGenerator("{0}:({1},{2})", NumberFormat.getNumberInstance(), NumberFormat.getPercentInstance());
- pieplot.setLabelGenerator(standarPieIG);
- //没有数据的时候显示的内容
- pieplot.setNoDataMessage("无数据显示");
- pieplot.setLabelGap(0.02D);
- imageFilePath = JfreeChartUtils.class.getResource("/").getPath() + "/freemarkerTemplate/images/" + imageName + ".jpg";
- File fos_jpg = new File(imageFilePath);
- if (!fos_jpg.exists()) {
- fos_jpg.createNewFile();
- }
- // 输出到哪个输出流
- ChartUtilities.saveChartAsJPEG(fos_jpg, chart, // 统计图表对象
- 800, // 宽
- 800 // 高
- );
- }catch (Exception e){
- e.printStackTrace();
- }
- return imageFilePath;
- }
- }
- //折线中的点
- class Point {
- private int x;
- private int y;
- public Point() {
- }
- public Point(int x, int y) {
- this.x = x;
- this.y = y;
- }
- public int getX() {
- return x;
- }
- public void setX(int x) {
- this.x = x;
- }
- public int getY() {
- return y;
- }
- public void setY(int y) {
- this.y = y;
- <span style="font-size:14px;"> }
- }
- </span>
- <w:pict>
- <w:binData w:name="wordml://03000003${imagePath_index}.png" xml:space="preserve">${imagePath}</w:binData>
- <v:shape id="_x0000_i1028" type="#_x0000_t75" style="width:440pt;height:440pt">
- <v:imagedata src="wordml://03000003${imagePath_index}.png" o:title="6350.tmp"/>
- </v:shape>
- </w:pict>
但这里确实花了我很多时间,主要的坑如下:
1.freemarker标签的使用:尤其要注意是否为空的情况所以对于list还是map最好都加上这一句:
- <#if infoLocationList??&&infoLocationList?size gt 0>
2.Word模板另存为xml文件时一定要注意,如果是较高一点的版本有两种格式xml和2003xml这个在处理图片时有较大差别,我是使用2003xml版本(高版本的在处理图片时有错误),它在处理的时候需要将图片转成base64码具体代码如下:
- private String getImageStr(String imagePath) {
- String imgFile = imagePath;
- InputStream in = null;
- byte[] data = null;
- try {
- in = new FileInputStream(imgFile);
- data = new byte[in.available()];
- in.read(data);
- in.close();
- } catch (IOException e) {
- e.printStackTrace();
- }
- BASE64Encoder encoder = new BASE64Encoder();
- return encoder.encode(data);
- }
3.多张图片插入时会遇到图片重复记得改name和src,从List中取出数据并且实现插入多张图片:
- <w:p wsp:rsidR="00C46D75" wsp:rsidRDefault="00C46D75" wsp:rsidP="00AC571C"/>
- <#if infoLocationList??&&infoLocationList?size gt 0>
- <w:p wsp:rsidR="0051625F" wsp:rsidRDefault="007F46BC" wsp:rsidP="00AC571C">
- <w:r>
- <w:rPr>
- <w:rFonts w:hint="fareast"/>
- <wx:font wx:val="宋体"/>
- </w:rPr>
- <w:t>半年内手机号、身份证号、IP、GPS归属地信息分布</w:t>
- </w:r>
- </w:p>
- <#list infoLocationList as imagePath>
- <w:p wsp:rsidR="007F46BC" wsp:rsidRDefault="00E75FA4" wsp:rsidP="00AC571C">
- <w:r>
- <w:tab/>
- </w:r>
- <w:r wsp:rsidR="00946545" wsp:rsidRPr="00946545">
- <w:rPr>
- <w:noProof/>
- </w:rPr>
- <w:pict>
- <w:binData w:name="wordml://03000003${imagePath_index}.png" xml:space="preserve">${imagePath}</w:binData>
- <v:shape id="_x0000_i1028" type="#_x0000_t75" style="width:440pt;height:440pt">
- <v:imagedata src="wordml://03000003${imagePath_index}.png" o:title="6350.tmp"/>
- </v:shape>
- </w:pict>
- </w:r>
- </w:p>
- </#list>
- </#if>
5.有时候会遇到成功生成Word文档但是无法打开的情况,这时候可以根据错误提示用文本编辑工具来具体到哪一行去看看,如果遇到什么结束元素标签名称与开始标签名称不匹配多半是ftl中标签配对有问题(这个有时候即使没有改过也会出错,所以最好借助工具好好补齐标签)
6.乱码问题,主要是在Linux服务器上会出现,具体方法网上也有。
FROM:http://blog.csdn.net/my_sunshine_y/article/details/52773528