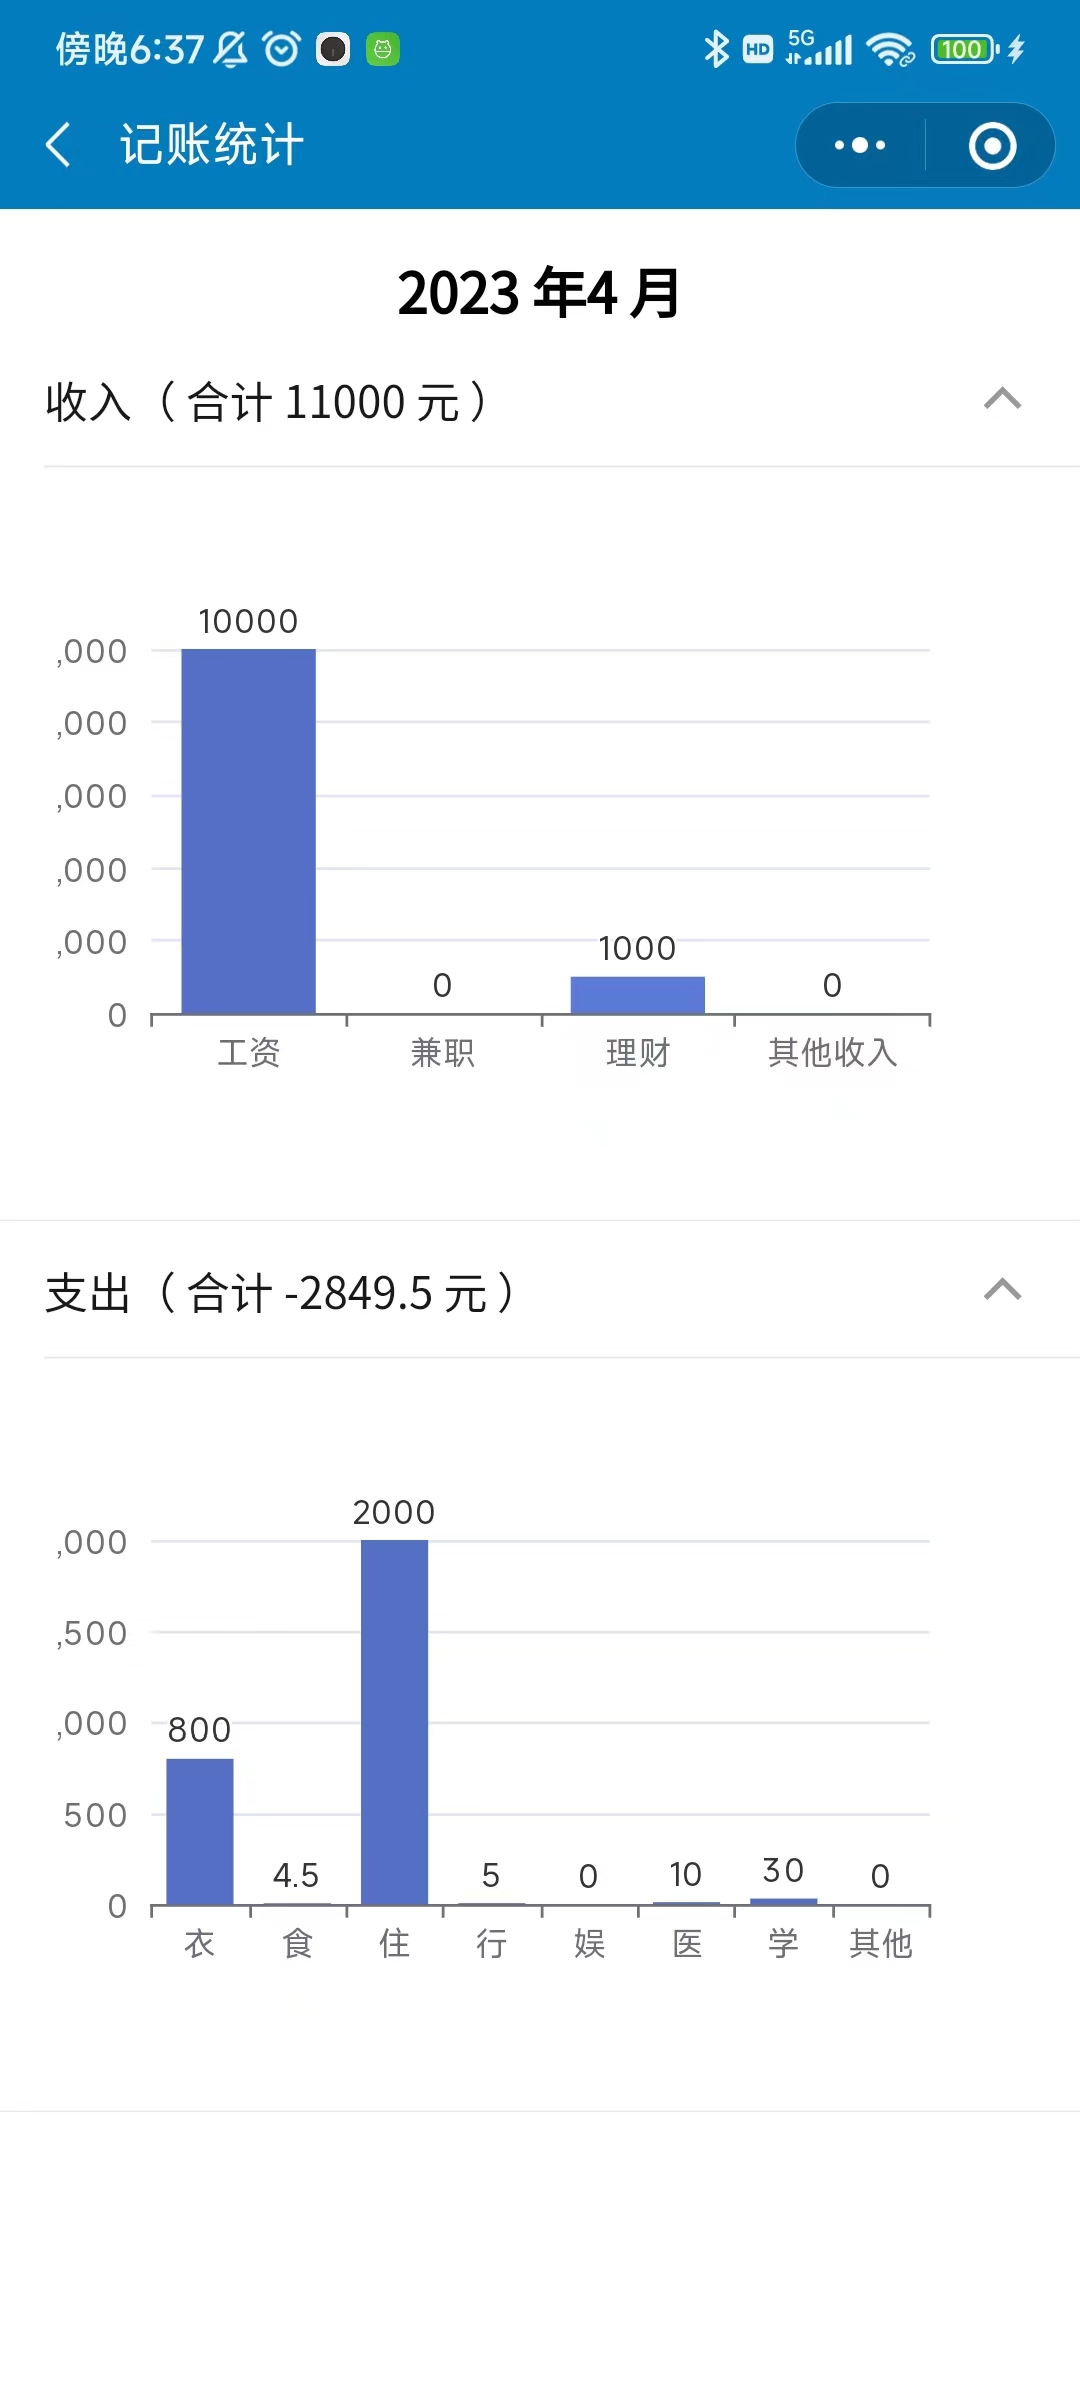
最终效果预览
实现流程
微信小程序中使用 echarts 需使用官方提供的 ec-canvas 组件
1. 下载 ec-canvas 组件
点击下方链接,下载 ec-canvas 组件
https://gitcode.net/mirrors/ecomfe/echarts-for-weixin/-/tree/master
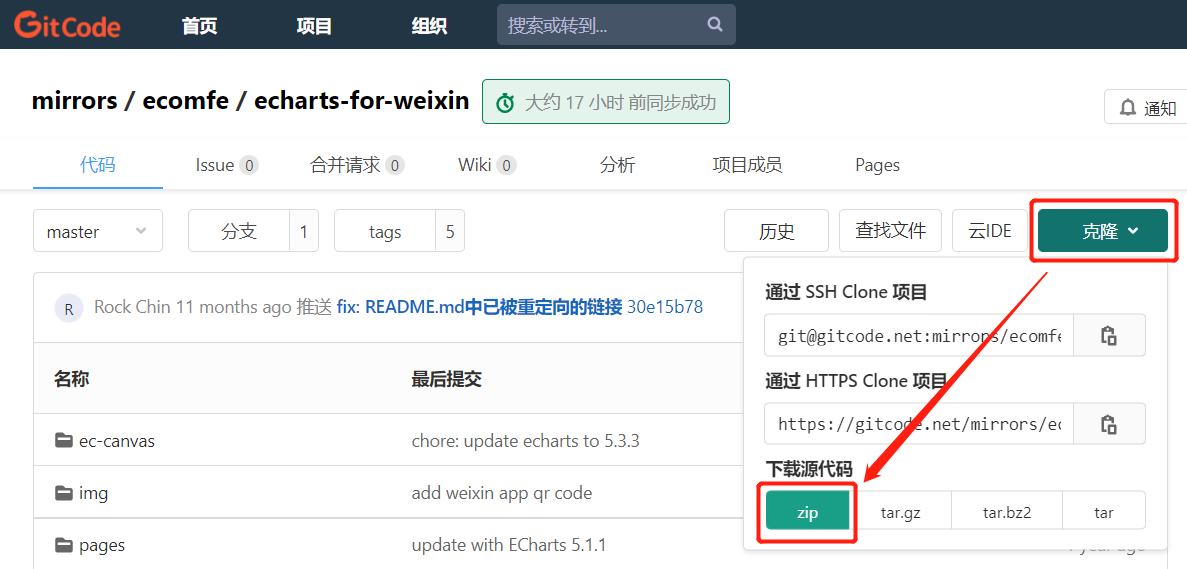
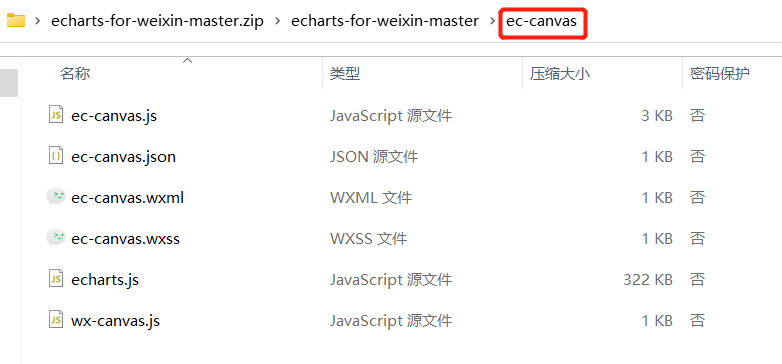
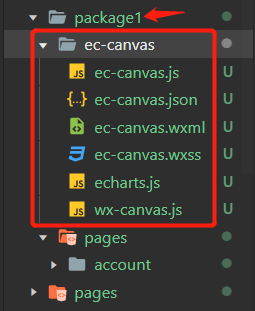
将其中的 ec-canvas 文件夹拷贝到微信小程序的分包中
( 因 ec-canvas 组件较大,约 1M,若放在主包中很容易超出 2M 的大小限制,不了解分包的朋友,可以参考博文 https://blog.csdn.net/weixin_41192489/article/details/130249743)
2. 引入 ec-canvas 组件
package1\pages\account\statistics\index.json
{


  "navigationBarTitleText": "记账统计",
  "usingComponents": {


    "t-collapse": "tdesign-miniprogram/collapse/collapse",
    "t-collapse-panel": "tdesign-miniprogram/collapse-panel/collapse-panel",
    "ec-canvas": "/package1/ec-canvas/ec-canvas"
  }
}
其中的核心代码为
"ec-canvas": "/package1/ec-canvas/ec-canvas"
3. 页面中使用 ec-canvas 组件
package1\pages\account\statistics\index.wxml
<view class="titleBox">
  {

   {year}} 年{

   {month}} 月
</view>
<t-collapse value="{

     {activeValues}}" bind:change="cardChange">
  <t-collapse-panel value="{

     {0}}" header="收入( 合计 {

     {sumIn}} 元 )" expandIcon>
    <view hidden="{

     {hideInChart}}" class="container">
      <ec-canvas id="mychart1" canvas-id="mychart1" ec="{

     { ec }}"></ec-canvas>
    </view>
  </t-collapse-panel>
  <t-collapse-panel value="{

     {1}}" header="支出( 合计 {

     {sumOut}} 元 )" expandIcon>
    <view hidden="{

     {hideOutChart}}" class="container">
      <ec-canvas id="mychart2" canvas-id="mychart2" ec="{

     { ec }}"></ec-canvas>
    </view>
  </t-collapse-panel>
</t-collapse>
核心代码为
<ec-canvas id="mychart1" canvas-id="mychart1" ec="{

     { ec }}"></ec-canvas>
此范例为一个页面渲染多个图表,需留意每个组件需有不同的 id
      <ec-canvas id="mychart2" canvas-id="mychart2" ec="{

     { ec }}"></ec-canvas>
4. 添加必要的 css
ec-canvas 组件默认没有尺寸,需手动添加必要的 css,才能显示。
package1\pages\account\statistics\index.wxss
.container {


  position: relative;
  width: 98%;
  height: 500rpx;
  margin: 0rpx auto;
}

ec-canvas {


  position: relative;
  width: 300rpx;
  height: 400rpx;
}

.titleBox {


  font-weight: bold;
  padding-top: 30rpx;
  font-size: 40rpx;
  text-align: center;
}
5. 获取数据,渲染图表
package1\pages\account\statistics\index.js
import * as echarts from '../../../ec-canvas/echarts';

Page({


  data: {


    // 数据列表
    dataList: [],
    // 是否隐藏收入图表
    hideInChart: false,
    // 是否隐藏支出图表
    hideOutChart: false,
    // 折叠卡片的值
    activeValues: [0, 1],
    // 图表配置
    ec: {


      // 图表懒加载的必要参数
      lazyLoad: true
    },
    // 收入类型
    inTypeList: ['工资', '兼职', '理财', '其他收入'],
    // 支出类型
    outTypeList: ['衣', '食', '住', '行', '娱', '医', '学', '其他支出']
  },
  // 折叠卡片切换
  cardChange(e) {


    this.setData({


      activeValues: e.detail.value,
    });
    this.updateData()
  },
  // 更新数据状态(控制图表的显隐)
  updateData() {


    let {


      activeValues
    } = this.data
    this.setData({


      hideInChart: !activeValues.includes(0),
      hideOutChart: !activeValues.includes(1)
    })
  },
  // 分类统计收入数据
  getInResult(dataList) {


    let {


      inTypeList
    } = this.data

    let inResultDic = {

    }

    dataList.forEach(item => {


      inTypeList.forEach(type => {


        if (!inResultDic[type]) {


          inResultDic[type] = 0
        }
        if (item.type === type) {


          inResultDic[type] += item.money
        }
      })
    })
    let yDataList = []

    inTypeList.forEach(type => {


      yDataList.push(inResultDic[type] || 0)
    })

    this.drawChart(this.ecComponent1, inTypeList, yDataList)
  },
  // 分类统计支出数据
  getOutResult(dataList) {


    let {


      outTypeList
    } = this.data

    let outResultDic = {

    }

    dataList.forEach(item => {


      outTypeList.forEach(type => {


        if (!outResultDic[type]) {


          outResultDic[type] = 0
        }
        if (item.type === type) {


          outResultDic[type] += item.money
        }
      })
    })
    let yDataList = []

    outTypeList.forEach(type => {


      yDataList.push(outResultDic[type] || 0)
    })
    // 因页面宽度有限,删除支出二字
    outTypeList[7] = '其他'
    this.drawChart(this.ecComponent2, outTypeList, yDataList)
  },
  onLoad() {


    let that = this
    // 接收传入的复杂数据
    const eventChannel = this.getOpenerEventChannel()
    eventChannel.on('sendData', function (res) {


      let {


        sumIn,
        sumOut,
        sumResult,
        year,
        month,
        dataList
      } = res
      that.setData({


        sumIn,
        sumOut,
        // 月结余
        balance: sumResult,
        year,
        month,
        dataList
      })
      that.ecComponent1 = that.selectComponent('#mychart1');
      that.ecComponent2 = that.selectComponent('#mychart2');
      that.getInResult(dataList)
      that.getOutResult(dataList)
    })
  },
  // 绘制图表
  drawChart(ecComponent, xDataList, yDataList) {


    ecComponent.init((canvas, width, height, dpr) => {


      // 获取组件的 canvas、width、height 后的回调函数
      // 在这里初始化图表
      const chart = echarts.init(canvas, null, {


        width: width,
        height: height,
        devicePixelRatio: dpr
      });
      this.setOption(chart, xDataList, yDataList);

      // 注意这里一定要返回 chart 实例,否则会影响事件处理等
      return chart;
    });
  },
  // 柱状图配置
  setOption(chart, xDataList, yDataList) {


    let option = {


      xAxis: {


        type: 'category',
        data: xDataList
      },
      yAxis: {


        type: 'value'
      },
      series: [{


        data: yDataList,
        type: 'bar',
        label: {


          show: true,
          position: "top"
        }
      }]
    }
    chart.setOption(option);
  }
})
核心代码解析
- 导入 echarts
import * as echarts from '../../../ec-canvas/echarts';
- 获取页面图表节点
that.ecComponent1 = that.selectComponent('#mychart1');
- 绘制图表
  // 绘制图表
  drawChart(ecComponent, xDataList, yDataList) {


    ecComponent.init((canvas, width, height, dpr) => {


      // 获取组件的 canvas、width、height 后的回调函数
      // 在这里初始化图表
      const chart = echarts.init(canvas, null, {


        width: width,
        height: height,
        devicePixelRatio: dpr
      });
      this.setOption(chart, xDataList, yDataList);

      // 注意这里一定要返回 chart 实例,否则会影响事件处理等
      return chart;
    });
  },
- 添加图表配置
  setOption(chart, xDataList, yDataList) {


    let option = {


      xAxis: {


        type: 'category',
        data: xDataList
      },
      yAxis: {


        type: 'value'
      },
      series: [{


        data: yDataList,
        type: 'bar',
        label: {


          show: true,
          position: "top"
        }
      }]
    }
    chart.setOption(option);
  }
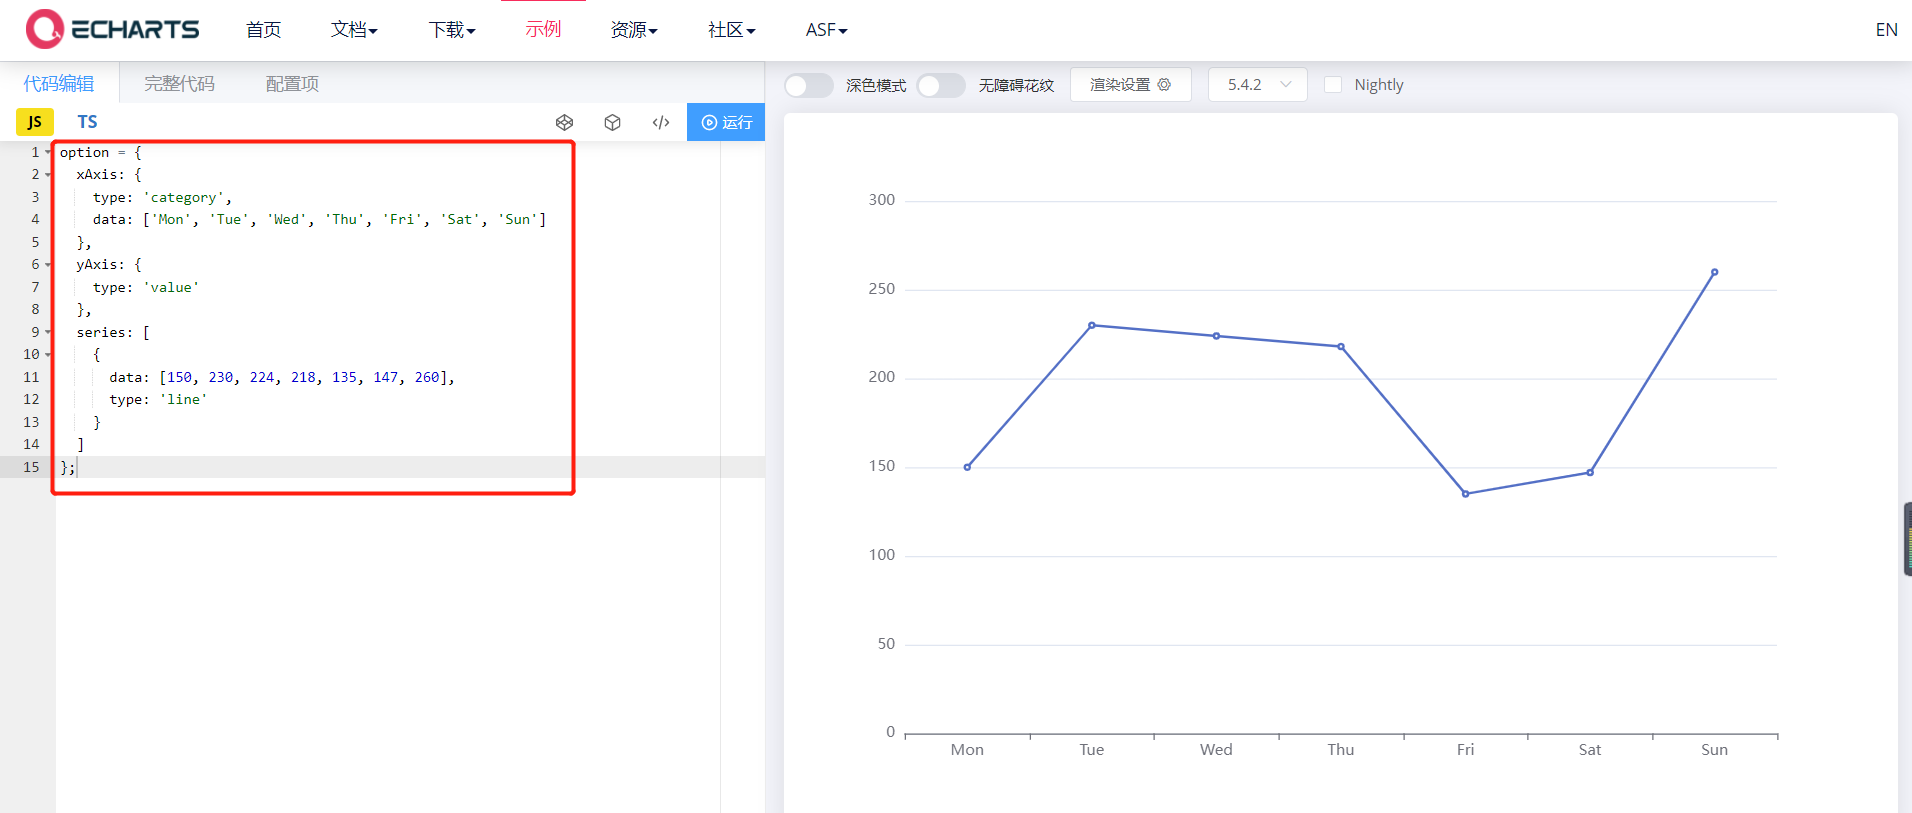
想绘制其他类型的图表,参考 echarts 官网修改此配置即可
https://echarts.apache.org/examples/zh/index.html